Inbound and Outbound Tourism Performance Analysis for January–September 2025
Inbound Tourism: Record-High Quantitative Growth and Reduced Regional Concentration
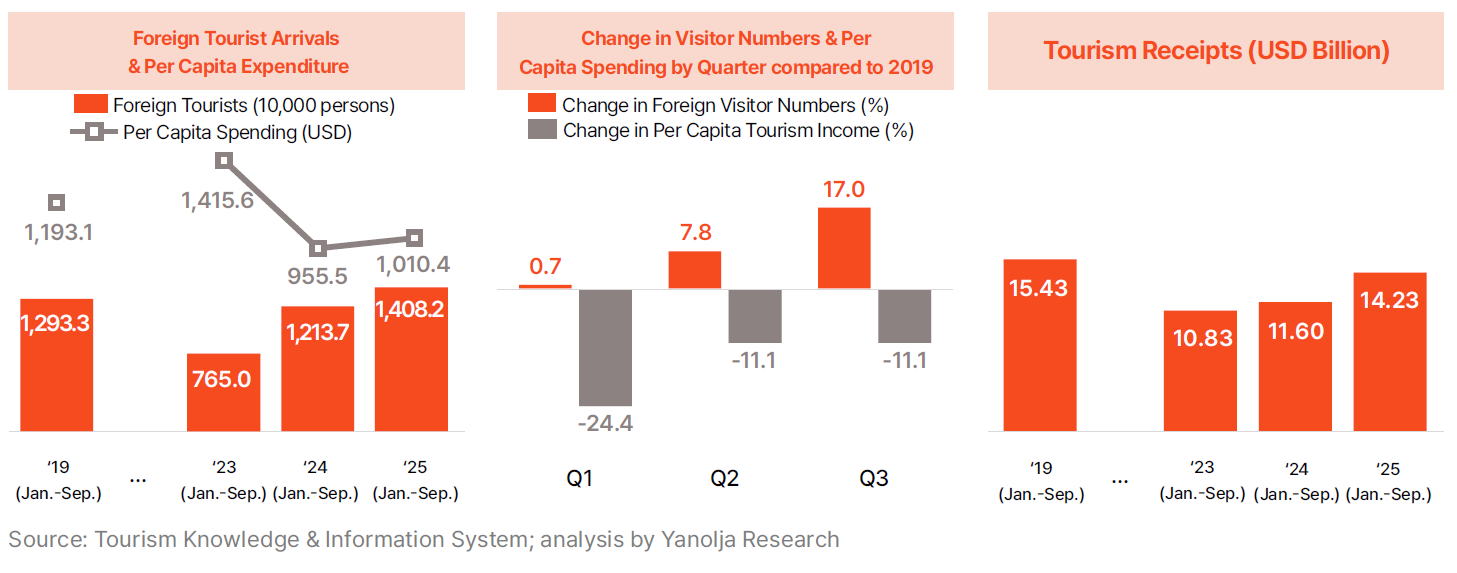
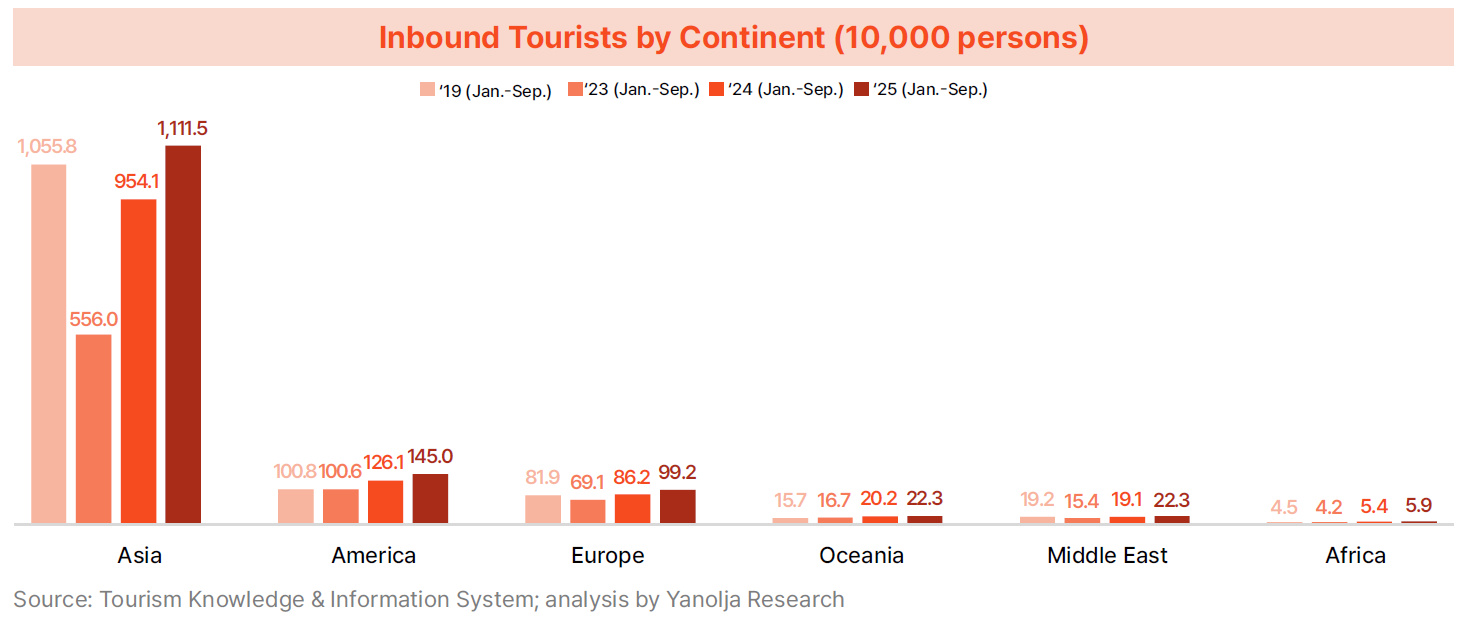
· From January to September 2025, the number of international visitors to Korea was approximately 14.082 million, an 8.9% increase from 12.933 million in the same period in 2019, marking the highest level ever recorded. Growth momentum accelerated each quarter—rising only 0.7% in Q1 compared to 2019, but expanding to 7.8% in Q2 and 17.0% in Q3, signaling a transition beyond recovery into a phase of full-scale growth.
· Recovery speed varied significantly by region. The Asian market, which had been the only region not fully recovered through 2024, slightly surpassed pre-pandemic levels in 2025. The number of Asian visitors declined from 10.558 million in 2019 to 5.560 million in 2023, rebounded to 9.541 million in 2024, and then increased further to 11.1155 million in 2025, reaching its highest level since 2019. Markets outside Asia also recorded strong recoveries, with visitors from the Americas rising from 1.008 million to 1.45 million, an increase of 43.9%, followed by Oceania at 42.5% (0.157 million to 0.223 million), Africa at 30.1% (0.0455 million to 0.059 million), Europe at 21.0% (0.819 million to 0.992 million), and the Middle East at 16.6% (0.192 million to 0.223 million). These trends demonstrate that Korea’s inbound tourism market is transitioning from heavy reliance on specific regions to a more diversified multi-regional structure.
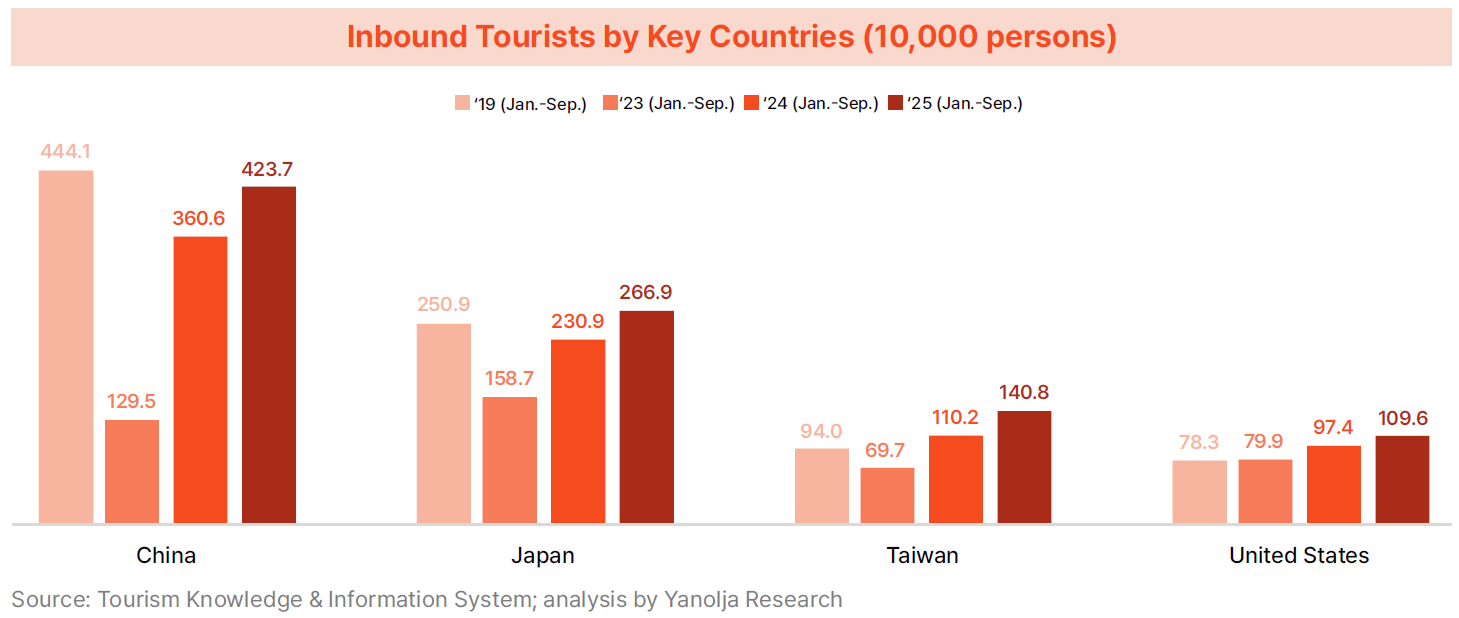
· By country, China remained the largest inbound market. Chinese visitors dropped sharply from 4.441 million in 2019 to 1.295 million in 2023, but rebounded to 3.606 million in 2024 and 4.237 million in 2025, nearing pre-pandemic levels. Japan also showed rapid recovery—though still below 2019 levels through early 2025, strong Q3 growth pushed cumulative arrivals to 2.669 million, surpassing the 2019 figure of 2.509 million.
· Taiwan and the U.S. also demonstrated robust growth. Taiwanese arrivals decreased from 0.94 million in 2019 to 0.697 million in 2023, rose to 1.102 million in 2024, and reached 1.408 million in 2025—up 49.8% from 2019, the most notable increase among key markets. U.S. visitors climbed steadily from 0.783 million in 2019 to 1.096 million in 2025, marking a 39.9% increase.
· While the number of inbound tourists has been increasing rapidly, the recovery of tourism income has been sluggish. Tourism income per capita, which was $1,193.1 in 2019, decreased to $955.5 in 2024, and reach only $1,010.4 in 2025, still far below the 2019 level. By quarter, this trend becomes even more pronounced. Compared to 2019, the growth rate of inbound tourists expanded each quarter in 2025, whereas per capita spending declined across all quarters — down 24.4% in Q1, 11.1% in Q2, and 11.1% in Q3. As a result, tourism income for January to September 2025 reached $14.23 billion, a 22.7% increase from the previous year, but only 92.2% of the level recorded in the same period in 2019 ($15.43 billion).
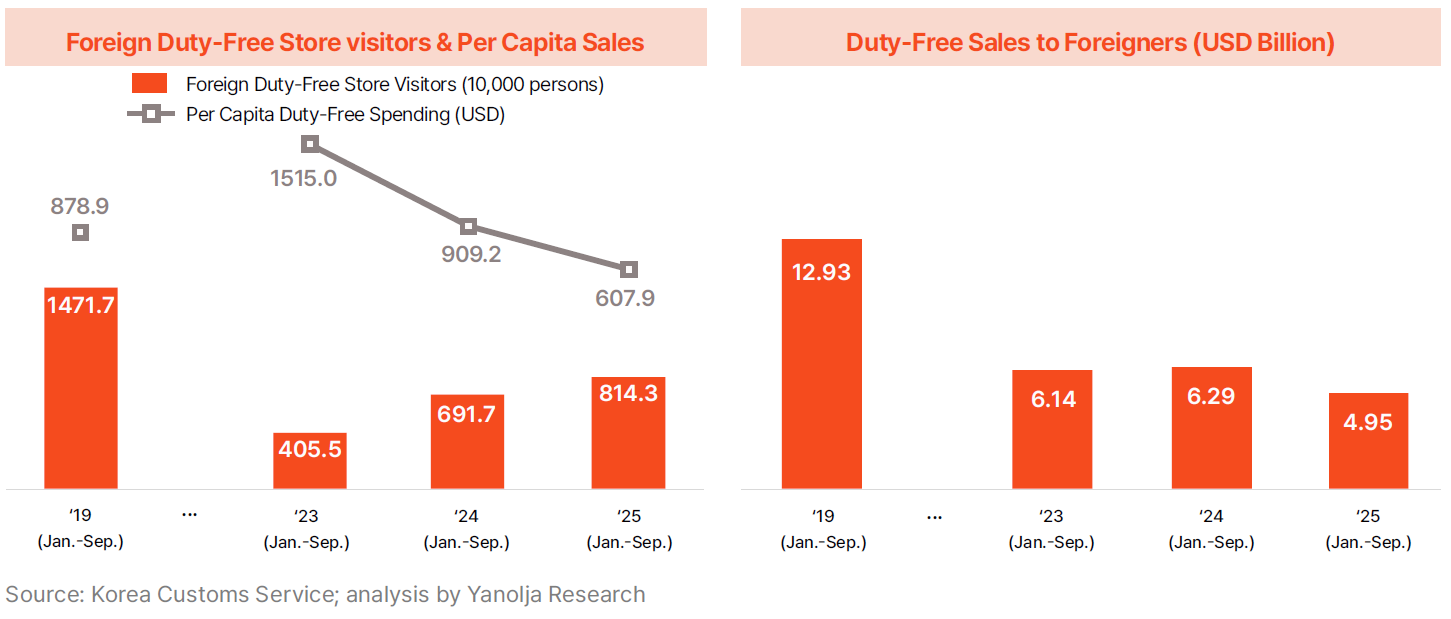
· A major factor behind the slow revenue recovery is the decline in duty-free store sales. The number of foreign duty-free shoppers fell from 14.717 million in 2019 to 4.055 million in 2023, then rose to 6.917 million in 2024 and 8.143 million in 2025—still significantly below pre-pandemic levels. Per-capita duty-free spending surged from $878.9 in 2019 to $1,515 in 2023 but then dropped sharply to $607.9 in 2025. Consequently, total duty-free sales fell from $12.93 billion in 2019 to $6.14 billion in 2023, $6.29 billion in 2024, and $4.95 billion in 2025.
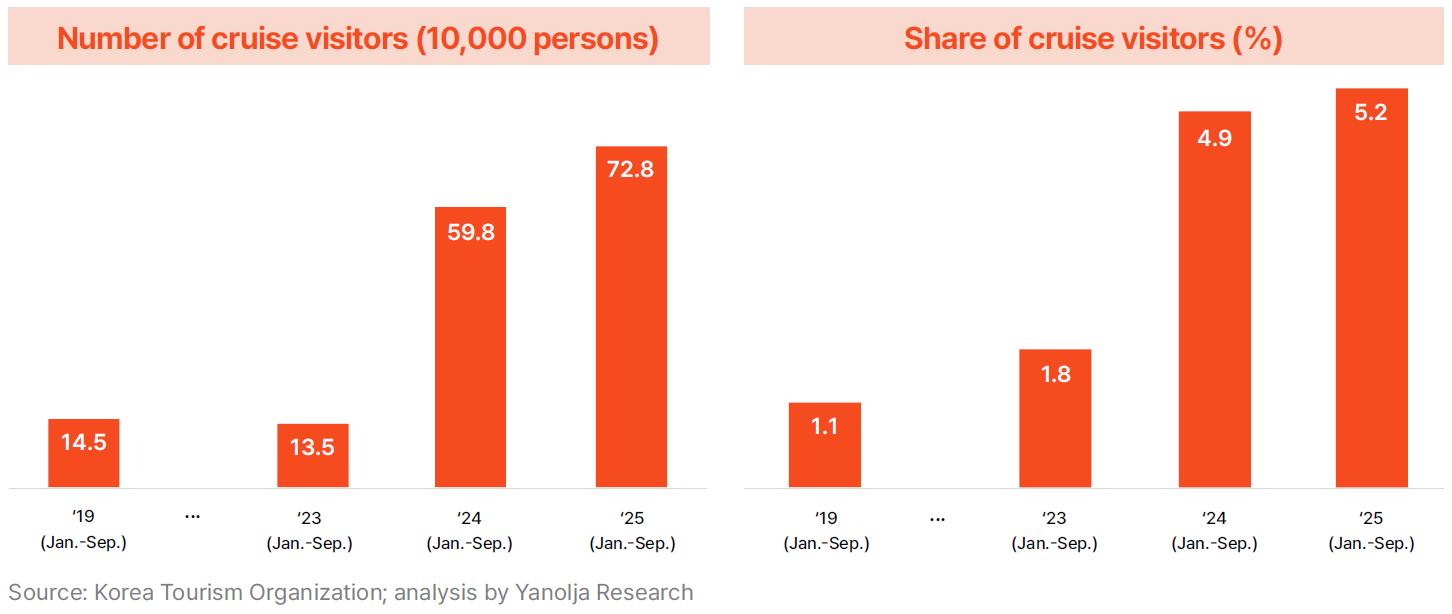
· Another contributing factor is the surge in cruise visitors. Cruise arrivals reached 728,000 between January and September 2025, more than five times the 145,000 recorded in 2019. Cruise travelers accounted for 5.2% of all inbound tourists, up sharply from 1.1% in 2019. While cruise tourism contributed to growth in total arrivals, it negatively impacted per-capita spending due to short onshore stays and limited consumer spending, creating a structural constraint that lowers average tourism revenue.
Outbound Tourism: Traveler Volume Near Pre-Pandemic Levels, Per-Capita Spending Surpasses 2019
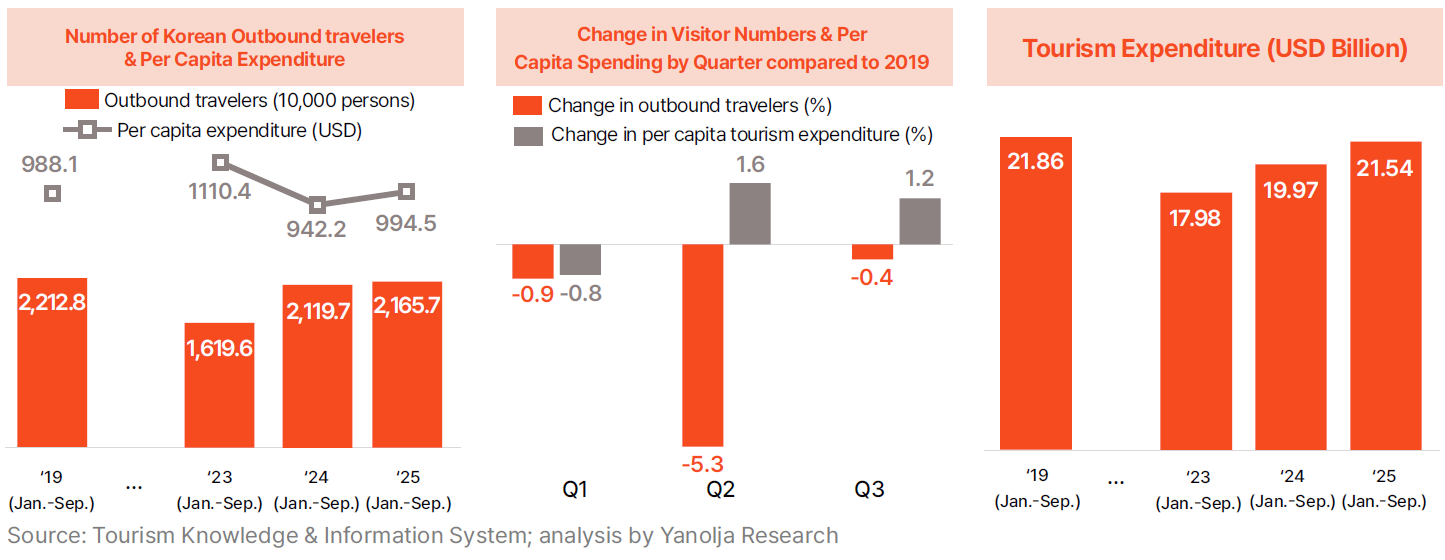
· Outbound tourism has nearly returned to pre-pandemic levels in terms of traveler volume, while per-capita spending has surpassed previous records. From January to September 2025, the number of Korean outbound travelers reached 21.657 million, approaching the pre-pandemic level of 22.128 million. This represents a 2.2% increase from 21.197 million in 2024, indicating that suppressed overseas travel demand has moved beyond the recovery phase and entered a stable normalization period. By quarter, outbound departures in 2025 were 0.9% below 2019 levels in Q1 and 5.3% below in Q2, but recovered to only 0.4% below in Q3, showing a gradual upward trajectory.
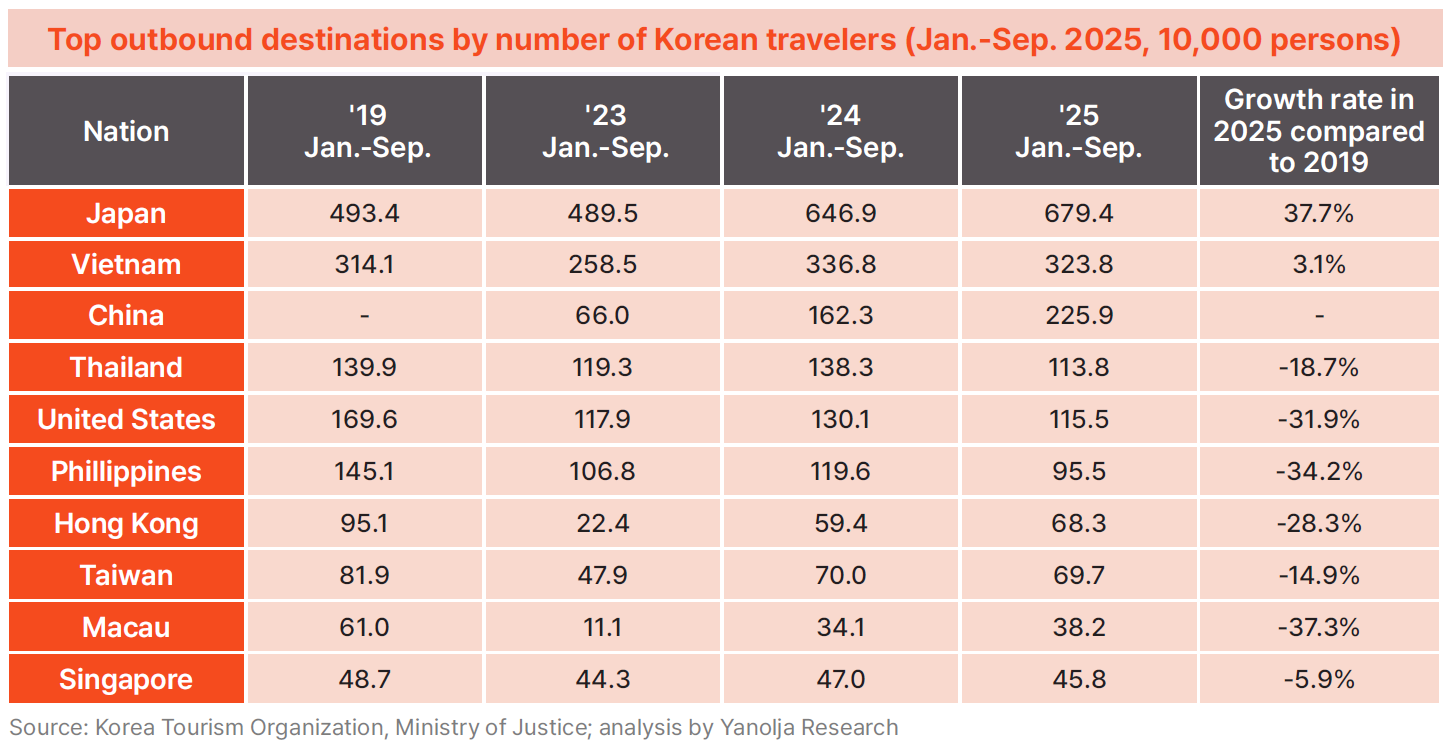
· Destination trends reveal a strong Asia-centered recovery, with Japan emerging as the key market driving outbound tourism. Travel to Japan increased from 4.934 million travelers in 2019 to 4.895 million in 2023, and then rose sharply to 6.469 million in 2024 and 6.794 million in 2025, up 37.7% from pre-pandemic levels. Vietnam also continued to grow, rising from 3.141 million travelers in 2019 to 3.368 million in 2024 and 3.238 million in 2025—3.1% above 2019. Japan and Vietnam therefore appear to be leading the post-pandemic recovery of outbound tourism. Travel to China has also rebounded rapidly, increasing from 0.66 million in 2023 to 1.623 million in 2024 and 2.259 million in 2025.
· In contrast, travel to Thailand, the United States, the Philippines, Hong Kong, Taiwan, Singapore, and Macau remains below pre-pandemic levels. Thailand, which nearly returned to 2019 volume with 1.383 million travelers in 2024, declined to 1.138 million in 2025, down 18.7% from 2019. The United States also dropped from 1.696 million travelers in 2019 to 1.301 million in 2024 and 1.155 million in 2025, a 31.9% decrease. Significant declines were recorded for the Philippines (–34.2%), Hong Kong (–28.3%), Taiwan (–14.9%), Macau (–37.3%), and Singapore (–5.9%).
· Despite outbound traveler volume remaining slightly below 2019 levels, per-capita spending has increased. Average spending per outbound traveler rose from $988.1 in 2019 to $994.5 in 2025, recovering from a temporary decline to $942.2 in 2024. As a result, total outbound tourism expenditure reached $21.54 billion during January–September 2025, continuing steady growth and approaching the 2019 level of $21.86 billion. On a quarterly basis in 2025, per-capita spending increased by 1.6% in Q2 and 1.2% in Q3 relative to 2019, despite a slight dip of 0.8% in Q1.
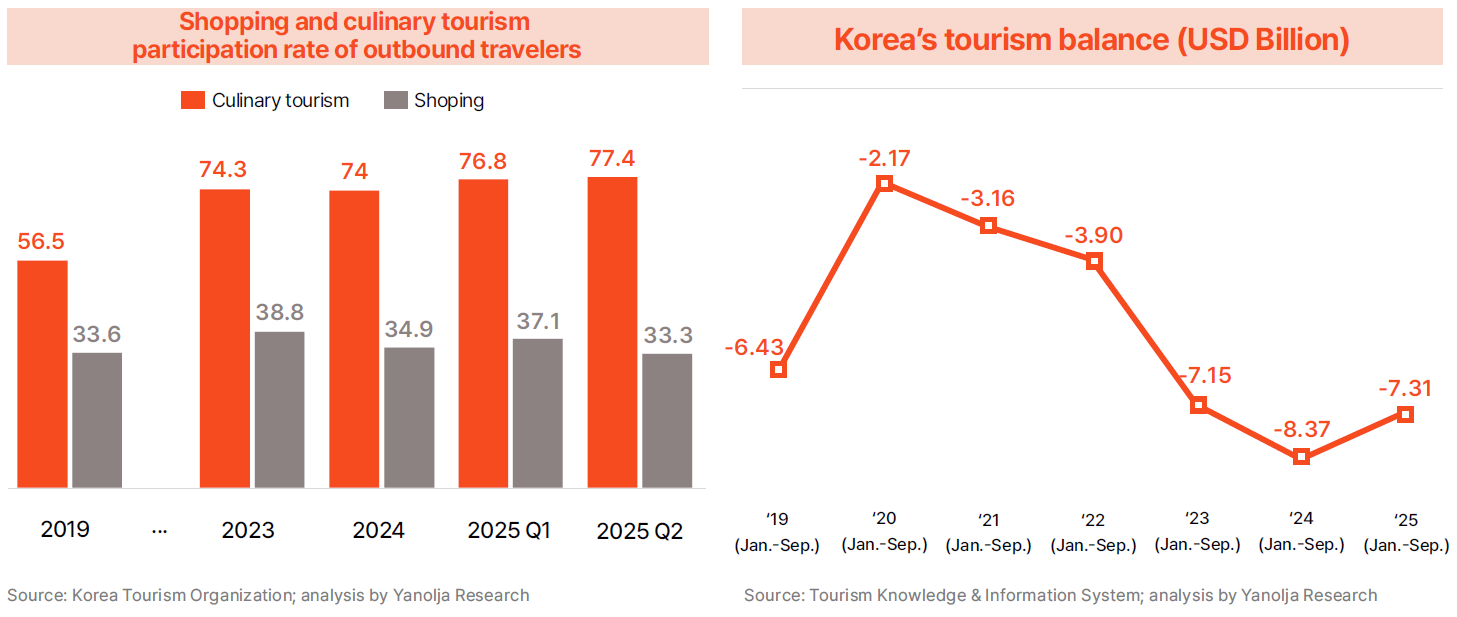
· The increase in outbound travel expenditure appears to reflect changes in traveler behavior. According to the Ministry of Culture, Sports and Tourism’s National Travel Survey, the proportion of spending on food tourism and shopping abroad has expanded significantly since the pandemic. Food-related travel rose from 56.5% in 2019 to 74.0% in 2024, and further to 76.8% in Q1 2025 and 77.4% in Q2. Shopping also increased from 33.6% in 2019 to 38.8% in 2023, maintaining higher-than-pre-pandemic levels at 34.9% in 2024, 37.1% in Q1 2025, and 33.3% in Q2.
Growing concerns over persistent tourism deficit and structural imbalance
· As outbound spending increases while inbound revenue remains slow to recover, the tourism balance deficit continues to widen. Korea’s tourism account balance recorded a deficit of $6.43 billion from January to September 2019, expanding to $7.15 billion in 2023, $8.37 billion in 2024, and remaining significantly negative at $7.31 billion in 2025. This indicates the growing entrenchment of a structural imbalance in which weak inbound spending and rapid outbound expenditure coexist.
K-Content as a Key Growth Engine for Inbound Tourism
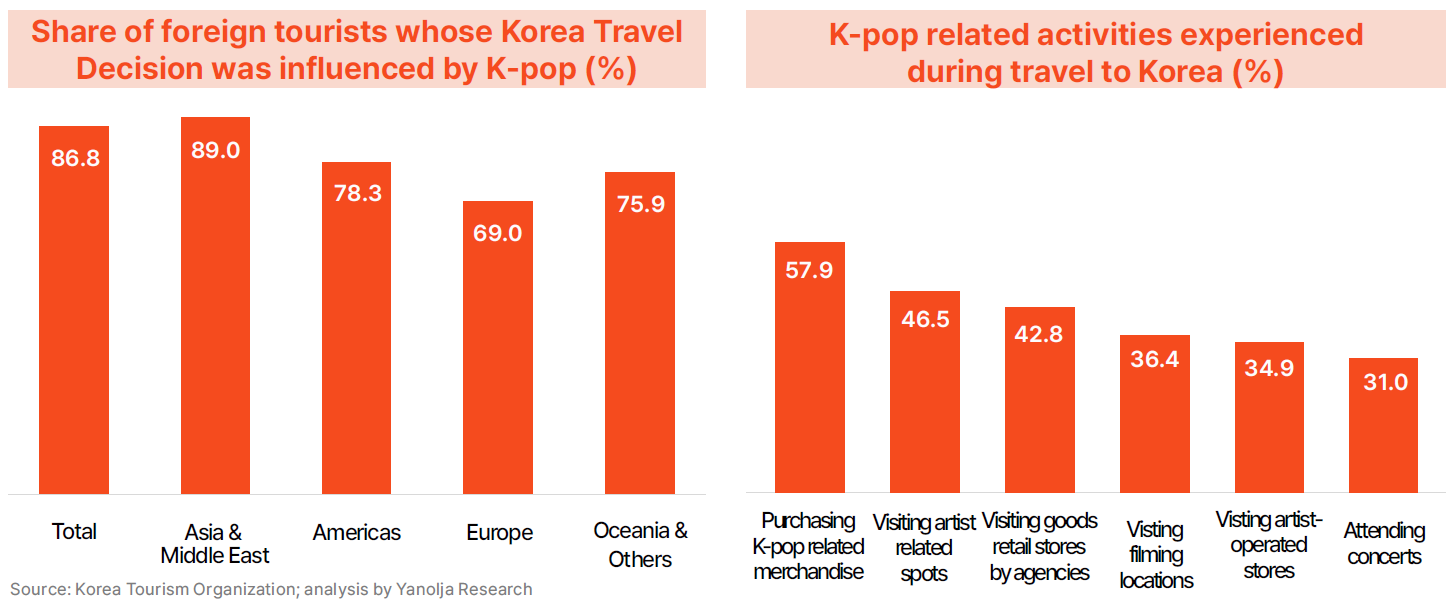
· To overcome the structural tourism deficit identified in the earlier analysis, it has become increasingly necessary to actively stimulate inbound tourism. In this context, K-content is viewed as the most realistic and powerful driver of growth. According to a survey of international visitors, 86.8% of respondents stated that their preference for K-pop influenced their decision to visit Korea, with particularly strong impact reported in Asia and the Middle East (89%), the Americas (78.3%), and Europe (69.0%). In addition, the K-pop activities most commonly experienced during travel were spending-based programs such as purchasing merchandise (57.9%), visiting sites of artist advertisements (46.5%), visiting entertainment agency stores (42.8%), touring filming locations (36.4%), visiting stores operated by artists (34.9%), and attending concerts (31%). These results demonstrate that the K-content fan base functions not merely as a passive interest group but as a core consumer segment driving real economic activity.
· A representative case illustrating the potential expansion of tourism demand driven by K-content is K-Pop Demon Hunters (abbreviated as KDH), an IP combining the K-pop universe with fantasy action elements. Since its release in June 2025, the film has rapidly attracted global fandom attention and become a major K-content success. Online interest in the locations featured in the film has risen sharply, highlighting the capacity of K-content to be transformed into tourism assets.
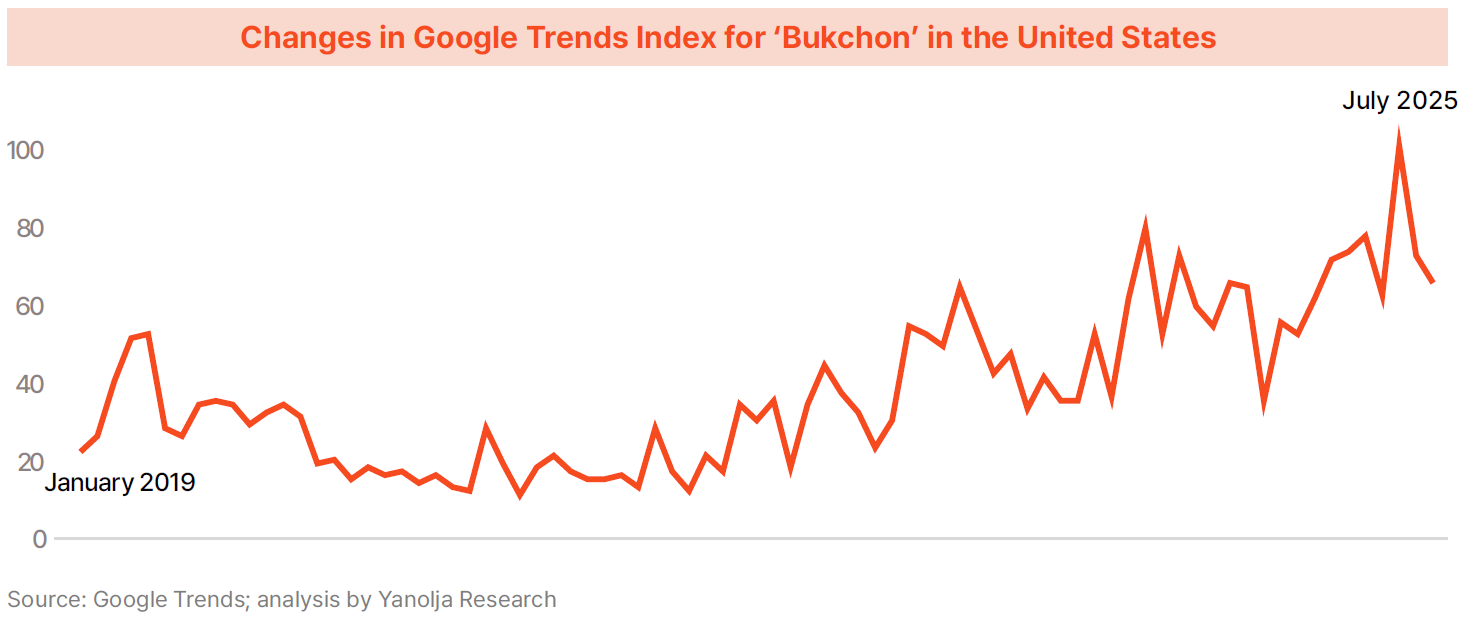
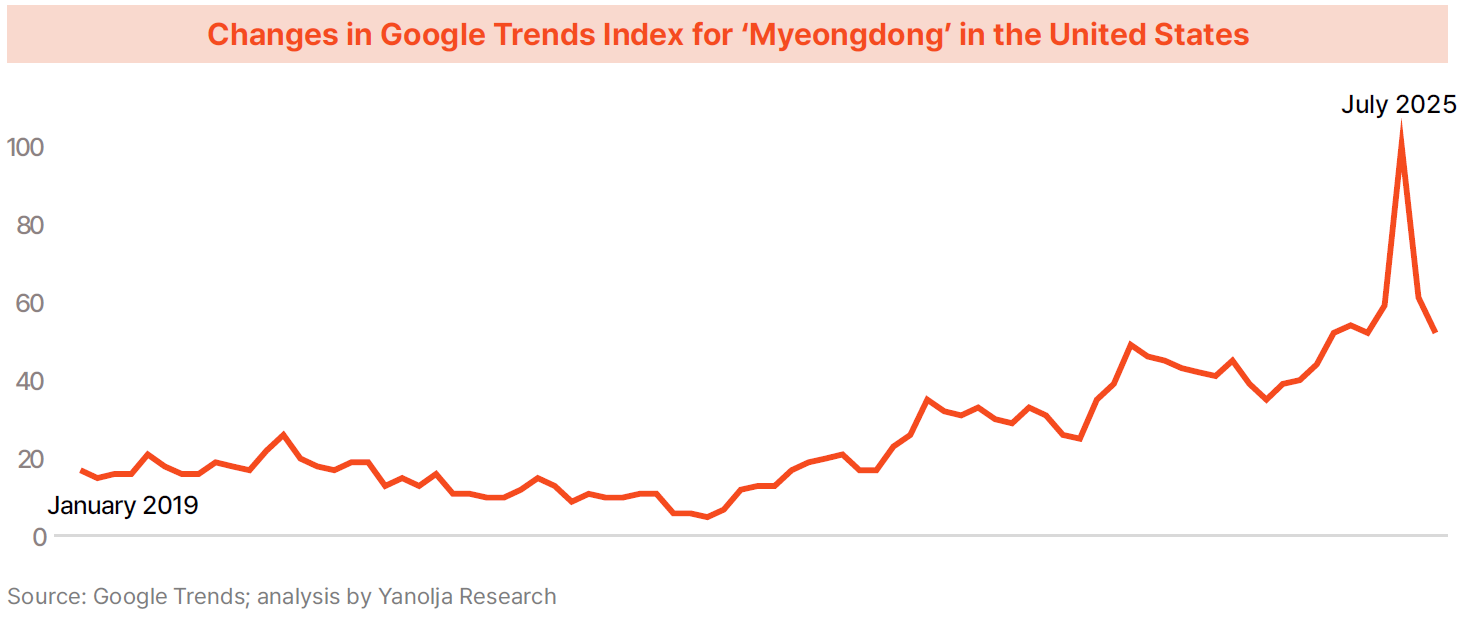
· Such rising interest is particularly evident around the “KDH Eight Scenic Spots.” Google Trends analysis shows that searches related to Bukchon Hanok Village and Myeong-dong—two of the highlighted locations—surged in July 2025 within key inbound source markets such as the United States. Following the film’s release, inbound tourist arrivals in Q3 2025 increased by 17.0% compared to 2019, demonstrating tangible performance beyond theoretical potential.
· Ultimately, K-content is considered one of the most effective solutions for alleviating the structural imbalance characterized by growing visitor volume but stagnant spending. Early signs indicate that K-content IP is beginning to convert online interest into actual tourism demand, suggesting that strategies linking K-content and tourism have the potential to evolve beyond promotional campaigns into a core framework for building a new consumption ecosystem.