Yanolja Attractiveness Index:
Understanding a Metric for Measuring the Attractiveness of Global Tourism Cities
SooCheong Jang, Professor at Purdue University & Director at Yanolja Research / [email protected]
Kyuwan Choi, Professor at Kyung Hee University & Director H&T Analytics Center / [email protected]
Hyo Won Yoon, Senior Researcher at Yanolja Research / [email protected]
In the post-pandemic era, competition in the global tourism market has intensified more than ever. As national borders reopen, cities worldwide are engaged in a silent battle to capture the hearts of travelers. In this context, the ability to accurately assess a city’s tourism competitiveness and to establish sound strategies has emerged as a core task for ensuring both economic prosperity and sustainable growth.
However, the current approaches to evaluating tourism competitiveness, upon which many cities and nations heavily rely, have critical blind spots. Traditionally, tourism competitiveness has been measured primarily through quantitative indicators such as the number of visitors, tourism revenue, hotel capacity, and the scale of airports. Even authoritative indices most frequently cited at the global level—such as the World Economic Forum’s Travel & Tourism Development Index (TTDI)—focus heavily on supply-side factors, including transportation infrastructure, government policy, and available resources. This is akin to attempting to evaluate a restaurant’s quality solely by the number of seats or the kitchen equipment it possesses.
Such supply-oriented indicators can indeed illustrate a city’s “capacity” to host tourists. Yet, they fail to address the fundamental questions of why travelers choose a particular city, what they feel during their visit, and whether they wish to return. In other words, these measures cannot explain a city’s true “attractiveness.” In today’s era—where social media and personalized experiences are redefining the essence of travel—the gap between “capacity” and “attractiveness” is widening. Travelers are no longer passive spectators but have transformed into active participants, immersing themselves in the unique narratives a city offers and engaging in emotional exchanges.
This shift serves as a strong signal that the conventional, supply-driven “old yardsticks” can no longer capture the dynamics of the market. The strategic risk of becoming a city that invests billions in infrastructure (high competitiveness) yet is shunned by travelers because it fails to win their hearts (low attractiveness) is greater than ever. This indicates a fundamental paradigm shift in the tourism industry. Whereas tourism in the past was akin to a logistics problem—focused on moving and
accommodating people and goods efficiently—contemporary tourism has evolved into the design and provision of “curated emotional journeys” that create positive emotions and lasting memories. The size of an airport or the number of hotel rooms
are merely prerequisites; they do not guarantee the quality of the journey itself. Therefore, the strategic objectives of cities and the tourism industry must shift from infrastructure development to the design and management of experiences.
Starting from this critical awareness, Yanolja Research, in collaboration with Purdue University’s CHRIBA Institute (U.S.) and Kyung Hee University’s H&T Analytics Center (Korea), developed the Global Tourism City Attractiveness Index (abbreviated as the Yanolja Attractiveness Index). The aim of this index goes beyond simple rankings; it seeks to fundamentally reframe our understanding of tourism competitiveness. By moving away from the perspective of suppliers and instead adopting that of demandside actors—namely, travelers—it provides a novel tool to measure a city’s genuine “pull,” that is, its attractiveness.
This report aims to provide insight into why this index is necessary, how ‘city attractiveness’ is academically defined and scientifically measured and analyzed, and what we can learn from the results to prepare for the future. This will pave the way for a new era where a city’s true value is not measured by the number of visitors but by the depth of the ‘affection’ that remains in their hearts.
Theoretical Background and Framework: Deconstructing the “Attractiveness” of Tourism Cities
To understand the true attractiveness of a tourism city, one must first address the fundamental question: “Why do people travel, and among countless destinations, how do they choose where to go?” The classic Push–Pull framework in tourism
studies provides a foundational lens to answer this question. According to the seminal Tourism Motivation Theory proposed by Dann (1977) and Crompton (1979), the question of why people travel is explained by internal drives, or Push factors, while
the question of where they travel is determined by the appealing characteristics of destinations, or Pull factors. Push factors refer to intrinsic and psychological needs— such as escape from routine, self-fulfillment, new experiences, learning, and stress relief—that motivate individuals to embark on a journey. Pull factors, on the other hand, are external attributes of the environment—such as natural scenery, cultural heritage, shopping opportunities, and accessibility—that act as compelling forces drawing travelers toward a specific destination.
In this context, tourism attractiveness can be seen as the critical intermediary that links travelers’ inner desires (Push) with external appeals (Pull). Attractiveness thus serves as both the fundamental driver of the decision to travel and the decisive
element influencing the choice of a particular destination. The concept of “attractiveness” is complex and multi-layered. Destination Image Theory suggests that individuals form both cognitive images (e.g., “Paris has the Eiffel Tower”) and affective images (e.g., “Paris is romantic”) of a given city. As Gartner (1994) argues, these cognitive and affective images ultimately shape tourists’ behavioral decisions to visit. Hence, a city’s attractiveness is not defined solely by the possession of tourism resources, but rather by the combined effect of cognitive and affective attributes as perceived and experienced by visitors. This includes not only tangible tourism assets but also the mental images and emotional responses that shape a city’s identity in the minds of travelers.
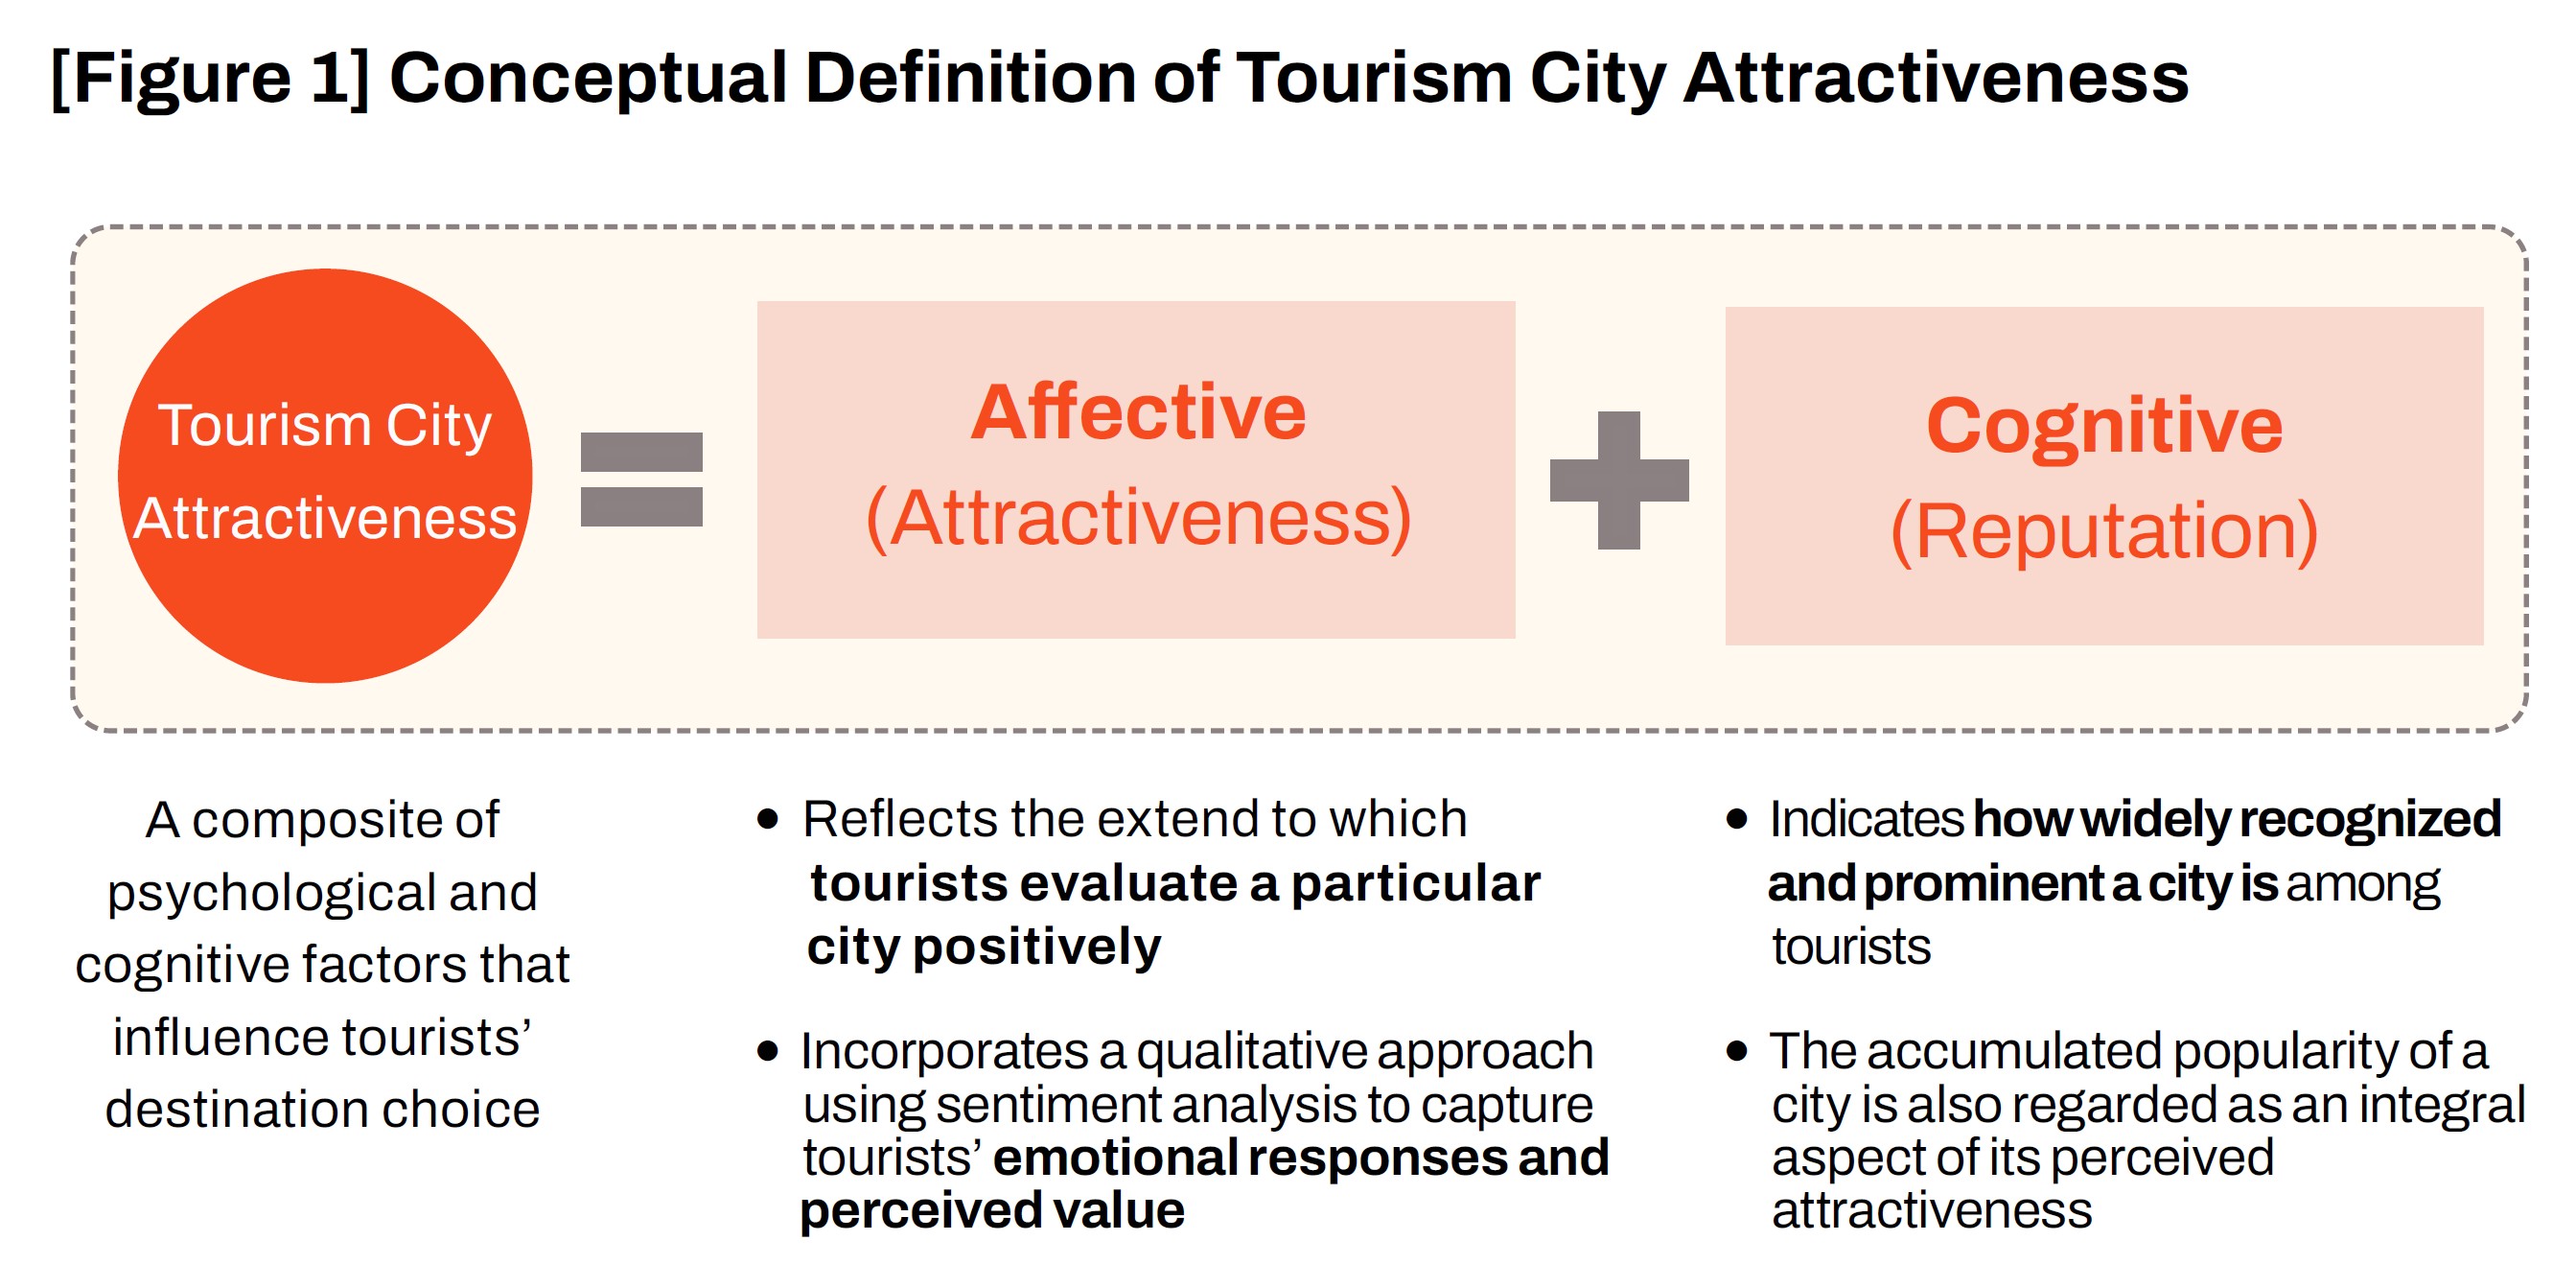
Building upon this theoretical foundation, the Global Tourism City Attractiveness Index introduces an original framework that conceptualizes urban attractiveness as being driven by two core engines: Reputation and Attractiveness. These two dimensions act respectively upon the rational and emotional evaluations of travelers, together determining a city’s overall appeal in a complementary manner.
• Reputation (Cognitive Engine): Reputation represents the quantitative dimension of urban appeal, corresponding to the “head-based” evaluations of travelers. It indicates how well a city is recognized and how frequently it is mentioned within global tourism discourse. Metrics such as social media buzz volume, search frequencies, and media coverage constitute its measurement. High reputation increases the likelihood that a city enters the evoked set of potential destinations. It functions
as social proof—“if many people are talking about it, it must be worth visiting”— thus reducing the perceived psychological risk of choice. In short, reputation is the prerequisite for a city to appear on travelers’ radars.
• Attractiveness (Affective Engine): Attractiveness reflects the qualitative dimension of appeal, corresponding to “heart-based” evaluations. It measures the extent to which travelers feel and express positive emotions toward a city. Statements such as “the food was extraordinary” or “the people were incredibly kind” exemplify this affective dimension. High attractiveness fosters pleasure, interest, and preference, creating emotional attachment to the city and leading to intentions
of revisitation and strong recommendations through word-of-mouth. In essence, attractiveness is the decisive factor that transforms a city into an unforgettable experience etched in travelers’ memories.
The interplay of these two engines provides a powerful diagnostic tool for assessing a city’s market positioning. Cities that score high in both reputation and attractiveness resemble blockbuster masterpieces, achieving both critical acclaim and commercial success. Cities with high attractiveness but low reputation are akin to hidden independent gems, admired passionately by niche audiences. Conversely, cities with high reputation but low attractiveness resemble overhyped productions, where flashy marketing raises expectations only to deliver disappointing experiences.
The true value of this framework lies in its ability to expose strategic imbalances from the perspective of cities competing to attract tourists. Many cities allocate substantial budgets to boost reputation through marketing, yet often neglect the actual quality of on-site experiences—that is, attractiveness. By comparing scores across these two axes, the index highlights the discrepancies between marketing messages and the lived quality of tourism offerings. Reputation may be the condition that brings travelers to a city, but sustainable success and loyal advocacy are ultimately built upon positive experiences grounded in attractiveness. In other words, reputation makes travelers know your city, but attractiveness makes them love it.
Conceptual Framework of Global Tourism City Attractiveness: Understanding the Mechanism
Building upon the theoretical background discussed above, the operational mechanism of Global Tourism City Attractiveness can be synthesized into a conceptual framework. First, an individual’s Push factors (internal motivations) stimulate the initial desire to travel, creating a behavioral intention: “I want to go somewhere.” At the subsequent stage of choosing a specific destination, Pull factors (external attributes of a destination) come into play, guiding the traveler’s judgment on which city can best satisfy that desire.
During this process, tourists perceive each city’s potential attractiveness, which can be examined through two evaluative lenses: cognitive evaluation (e.g., how well-known the city is, and what defining features it possesses—Reputation) and affective evaluation (e.g., how appealing and emotionally engaging the city feels— Attractiveness). Push factors influence affective evaluation, as travelers align their inner needs and preferences with the perceived experiential appeal of a destination (e.g., “I can find the restorative leisure I seek in this city”). Pull factors, by contrast, shape cognitive evaluations through objective information and external attributes (e.g., “This city has famous beaches and a safe environment”). The overall attractiveness of a city thus emerges as the combination of these cognitive and affective dimensions, which together determine the ultimate decision to visit.
For example, suppose a tourist feels a push motivation to “escape daily life and relax” (internal factor) and, while looking for a resort, encounters pull information about an "island famous for its beautiful and quiet scenery." This tourist will simultaneously assess how famous the island is and what good reviews it has (cognitive factor) while also imagining if it has the attractiveness to provide the relaxation they are seeking (affective factor). If both are positive, they will rate the island's attractiveness highly and decide to visit. Conversely, if the scenery looks good but the security seems unstable (negative cognitive reputation), or if it's famous but feels too commercialized to provide true rest (low affective attractiveness), their intention to visit might be discouraged.
This integrated tourism attractiveness mechanism offers multiple implications for understanding and leveraging tourist behavior. For instance, tourism policymakers and destination marketers must recognize that enhancing a city’s internal qualities—such as the caliber of its contents and service standards—should be accompanied by efforts to strengthen its external reputation, including visibility and brand management. Moreover, by combining attractiveness indices with
existing competitiveness indicators, stakeholders can monitor whether supply-side improvements (e.g., infrastructure expansion) effectively translate into demand-side perceptions of heightened attractiveness. This integration provides concrete insights for strategic planning and performance evaluation.
Ultimately, adopting this demand-driven perspective—which encompasses Push–Pull factors alongside cognitive and affective dimensions of destination attractiveness— equips urban planners and tourism strategists to continuously track and foster a virtuous cycle: attracting visitors, delivering memorable experiences, encouraging positive evaluations, and generating repeat visits and recommendations.
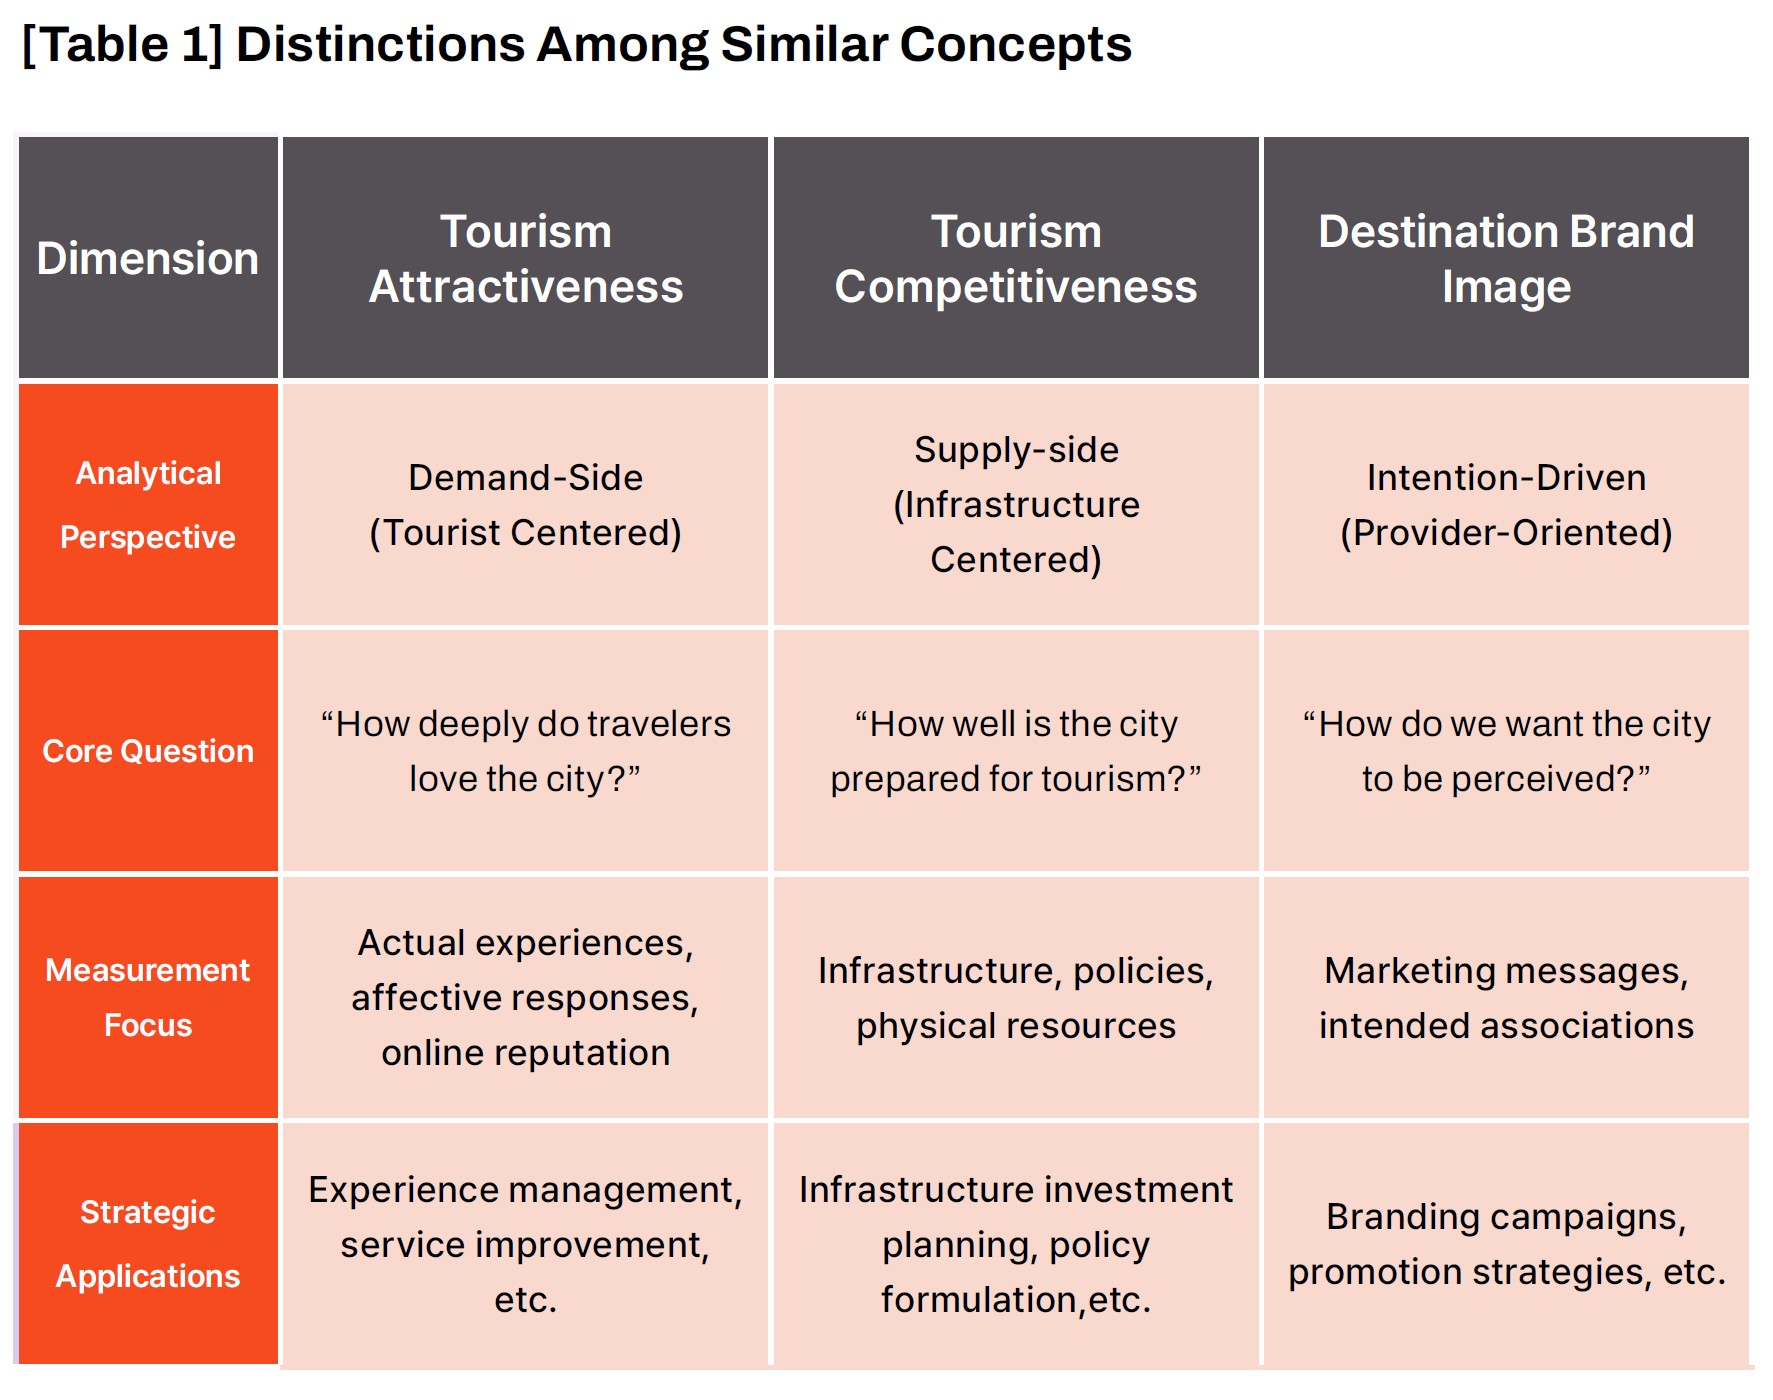
Differentiating a New Lens of Measurement: Comparing Attractiveness with Competitiveness and Brand Image
The Global Tourism City Attractiveness Index is not intended to replace existing notions such as tourism competitiveness or brand image. Rather, it complements them by reinforcing an additional dimension these concepts fail to fully capture—namely, the attractiveness of a tourism city. A city may boast high competitiveness through well-developed infrastructure and cultivate a strong brand image through costly advertising campaigns, yet if travelers’ actual experiences fall short, the city will fail the test of attractiveness. The index therefore evaluates how supply-side investments and policies translate into outcomes in the minds and emotions of tourists.
When a discrepancy emerges between a city’s competitiveness ranking and its attractiveness score, it signals a strategic problem: either assets are not being transformed into compelling experiences, or branding efforts are misaligned with reality. This “gap” is precisely the kind of insight that the Attractiveness Index provides—an insight conventional indices cannot of fer. Tourism Destination Brand Image, by contrast, refers to the associations and affective impressions tourists hold about a destination, strategically managed through marketing—for instance, Paris evoking the Eiffel Tower, art, and romance.
While both concepts involve cognitive and affective evaluations, brand image is deliberately planned and cultivated by authorities or DMOs, whereas attractiveness reflects tourists’ lived perceptions and experiences. Identifying divergences between the two provides critical evidence for developing more effective marketing and policy strategies.
Research Methodology: Data Collction and Analysis
How can the multifaceted concepts of Reputation and Attractiveness in cities be objectively measured as an index? The answer lies in the vast digital footprints voluntarily generated by hundreds of millions of travelers worldwide—that is, big
data. The Global Tourism City Attractiveness Index is grounded in cutting-edge data science methods, applying what can be termed “global-scale digital ethnography.” This approach goes beyond official promotional messages or controlled surveys and instead captures the unfiltered, authentic voices of travelers as they communicate with one another.
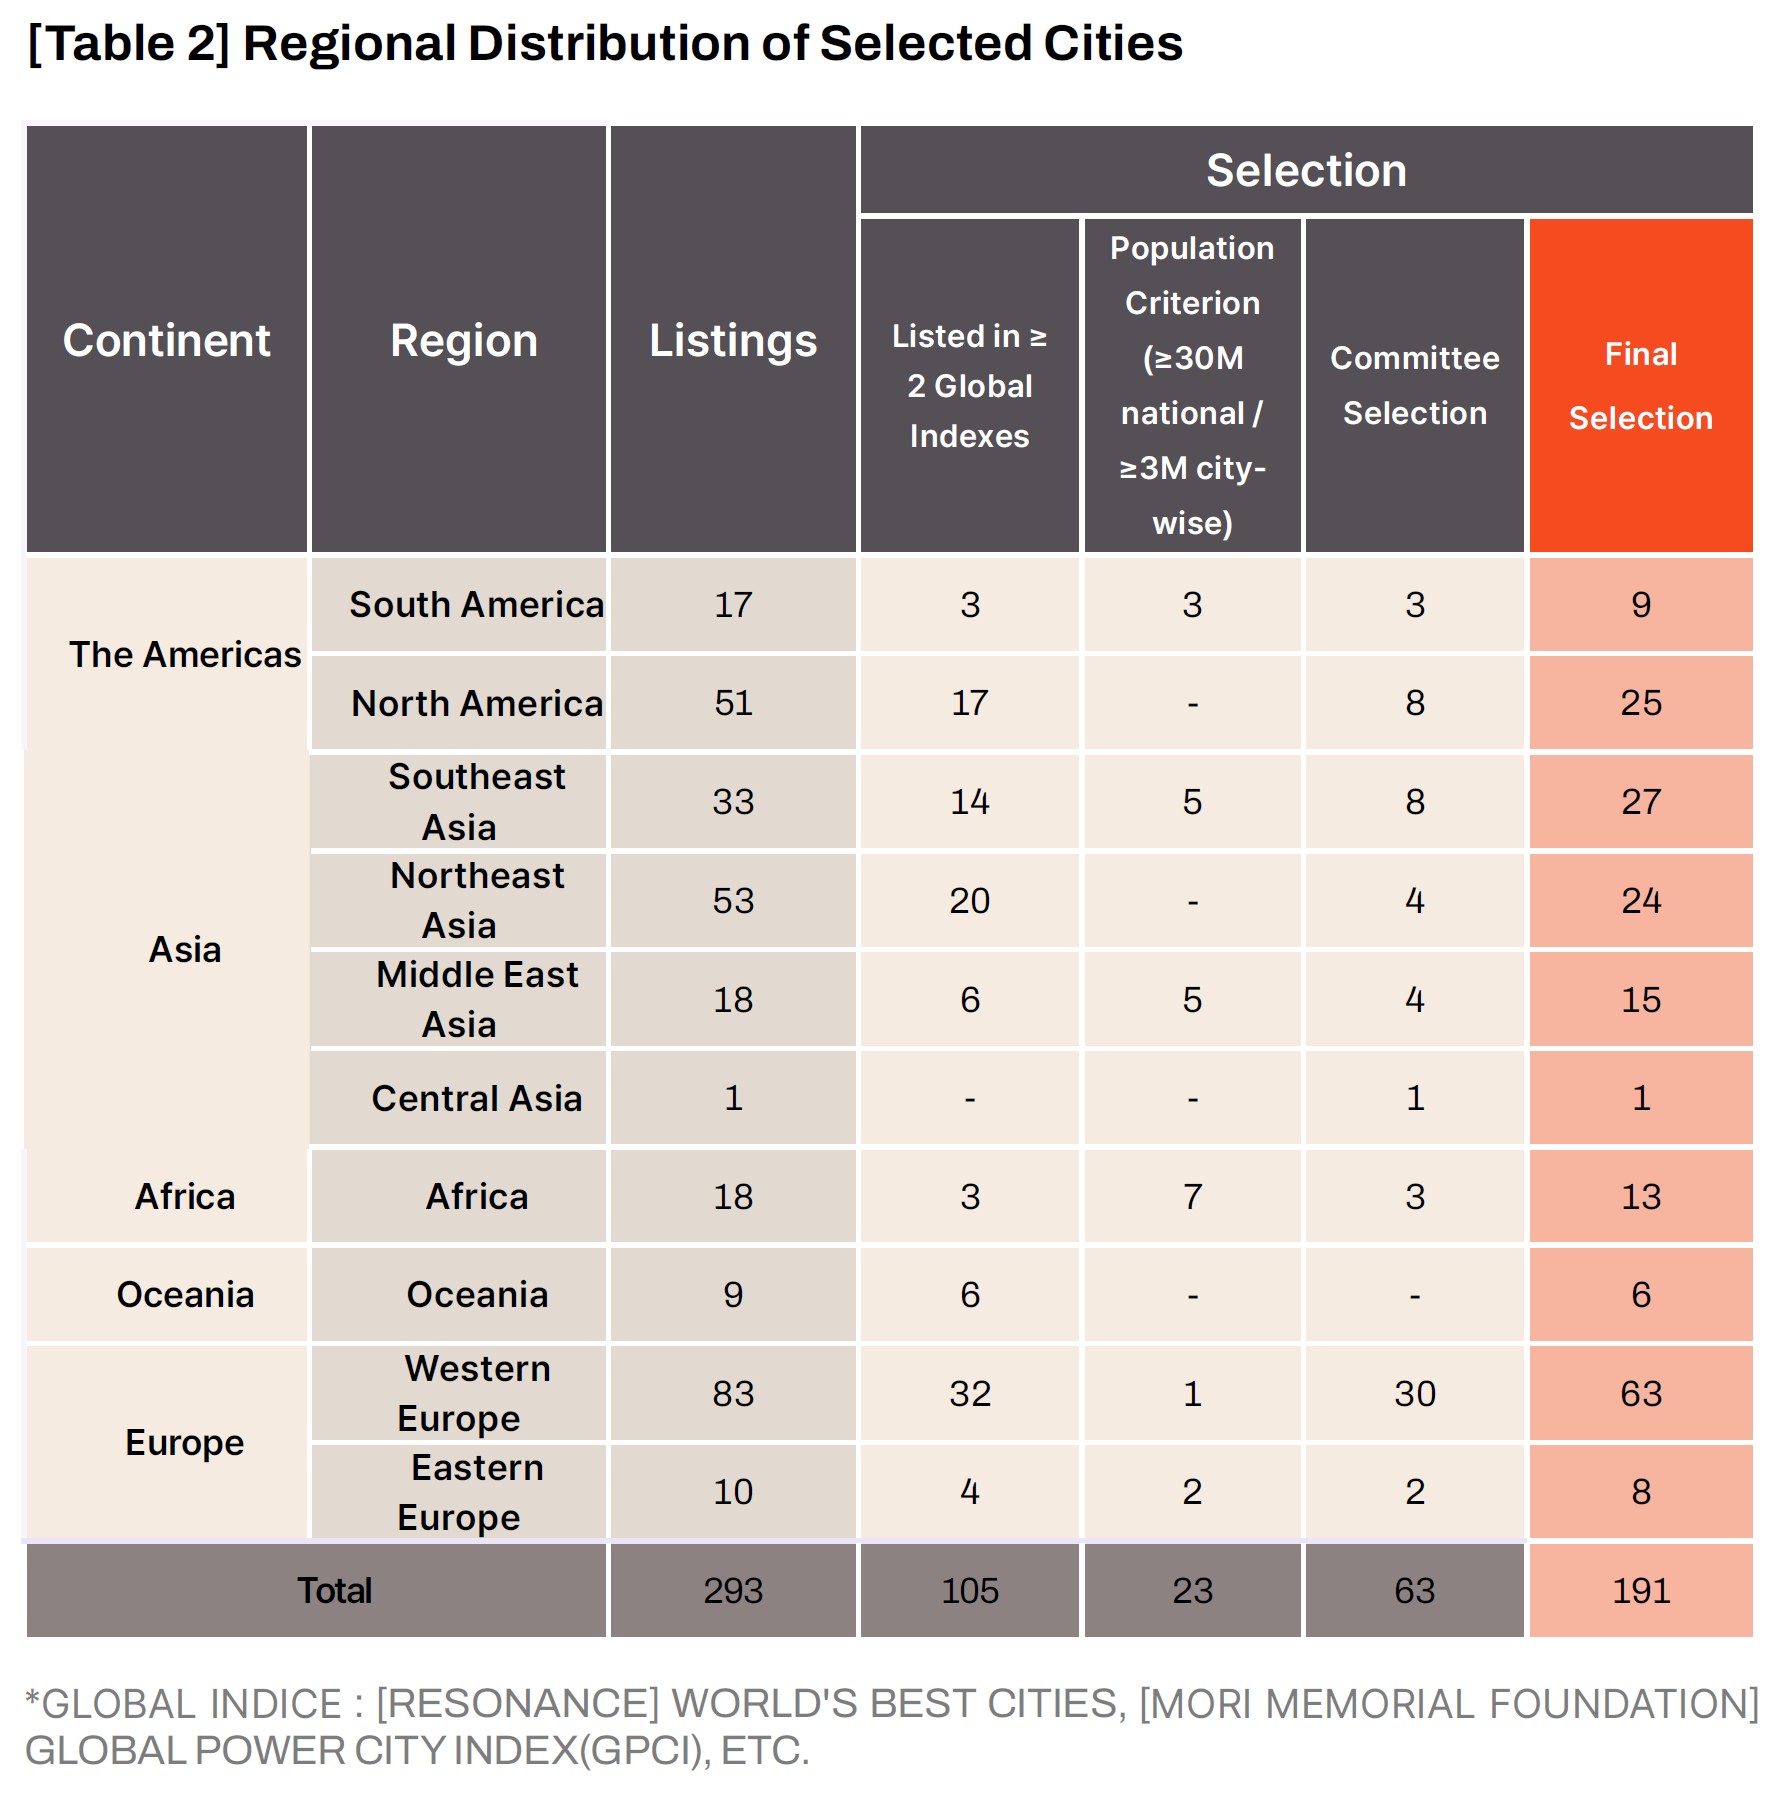
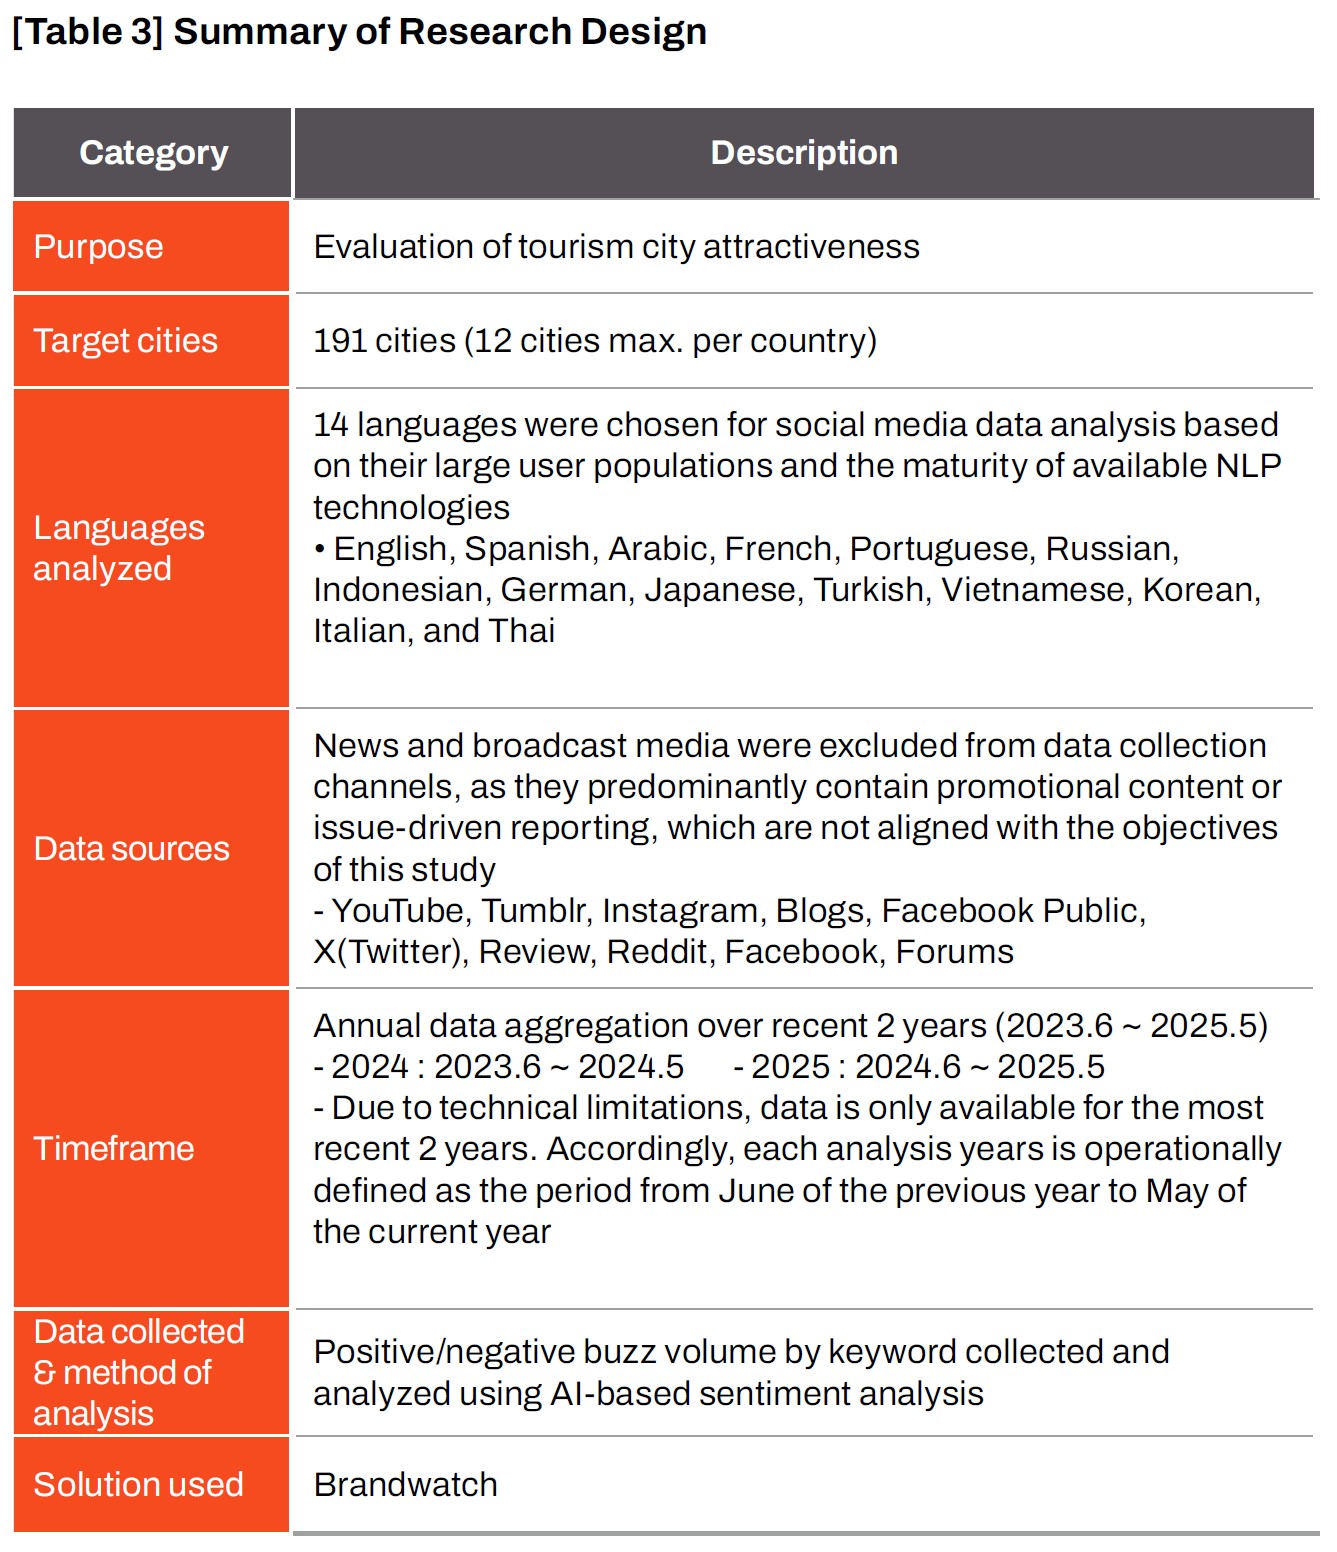
For this study, 191 tourism cities around the world were selected. The criteria were as follows: (1) cities ranked on at least two global tourism city lists; (2) cities in countries with populations over 30 million and city populations over 3 million; or (3) globally renowned tourism cities included on the basis of qualitative expert judgment, even if not captured by the preceding criteria. The final selection encompassed cities from across the globe. By region, Western Europe represented the largest share with 63 cities, many of which are distinguished by rich histories and cultural heritage. Eastern Europe contributed 8 cities. In Asia, numerous cities were included, broken down into 27 in Southeast Asia, 24 in Northeast Asia, 15 in the Middle East, and 1 in Central Asia. The Americas comprised 9 South American and 25 North American cities. Additionally, 13 cities from Africa and 6 from Oceania were included, ensuring geographic diversity.
For linguistic coverage, 14 languages were selected based on both the size of their user bases and the maturity of natural language processing (NLP) technologies suitable for social data analysis. These included English, French, Spanish, German,
Korean, Japanese, among others. Chinese was excluded due to governmental restrictions limiting the export of domestic social data.
The data collection focused on social data sources, excluding news reports and broadcasts that do not directly reflect public responses. Sources included major social networking services, blogs, forums, and online reviews worldwide. Data spanning the two most recent years (June 2023 – May 2025) were collected to reflect contemporary tourism trends, with analysis conducted separately for 2024 (June 2023 – May 2024) and 2025 (June 2024 – May 2025).
For keyword development, an initial library was constructed through expert consultation. A pilot test was then conducted on five cities, after which refinements produced the final keyword set. Using these city-specific keyword combinations, social data were collected and subjected to sentiment analysis with a transformerbased AI model provided by the global social data company Brandwatch. The outputs yielded city- and keyword-level volumes of positive and negative buzz, which formed the basis of the analysis.
As noted earlier, tourism city attractiveness is composed of two primary elements.
• Attractiveness (Qualitative Dimension): Measured through the proportion of positive sentiment across tourism-related keywords, indicating the extent to which a city is positively perceived by travelers.
• Reputation (Quantitative Dimension): Measured by buzz volume—the frequency with which a city is mentioned in connection with relevant keywords—reflecting the city’s salience and visibility in global discourse.
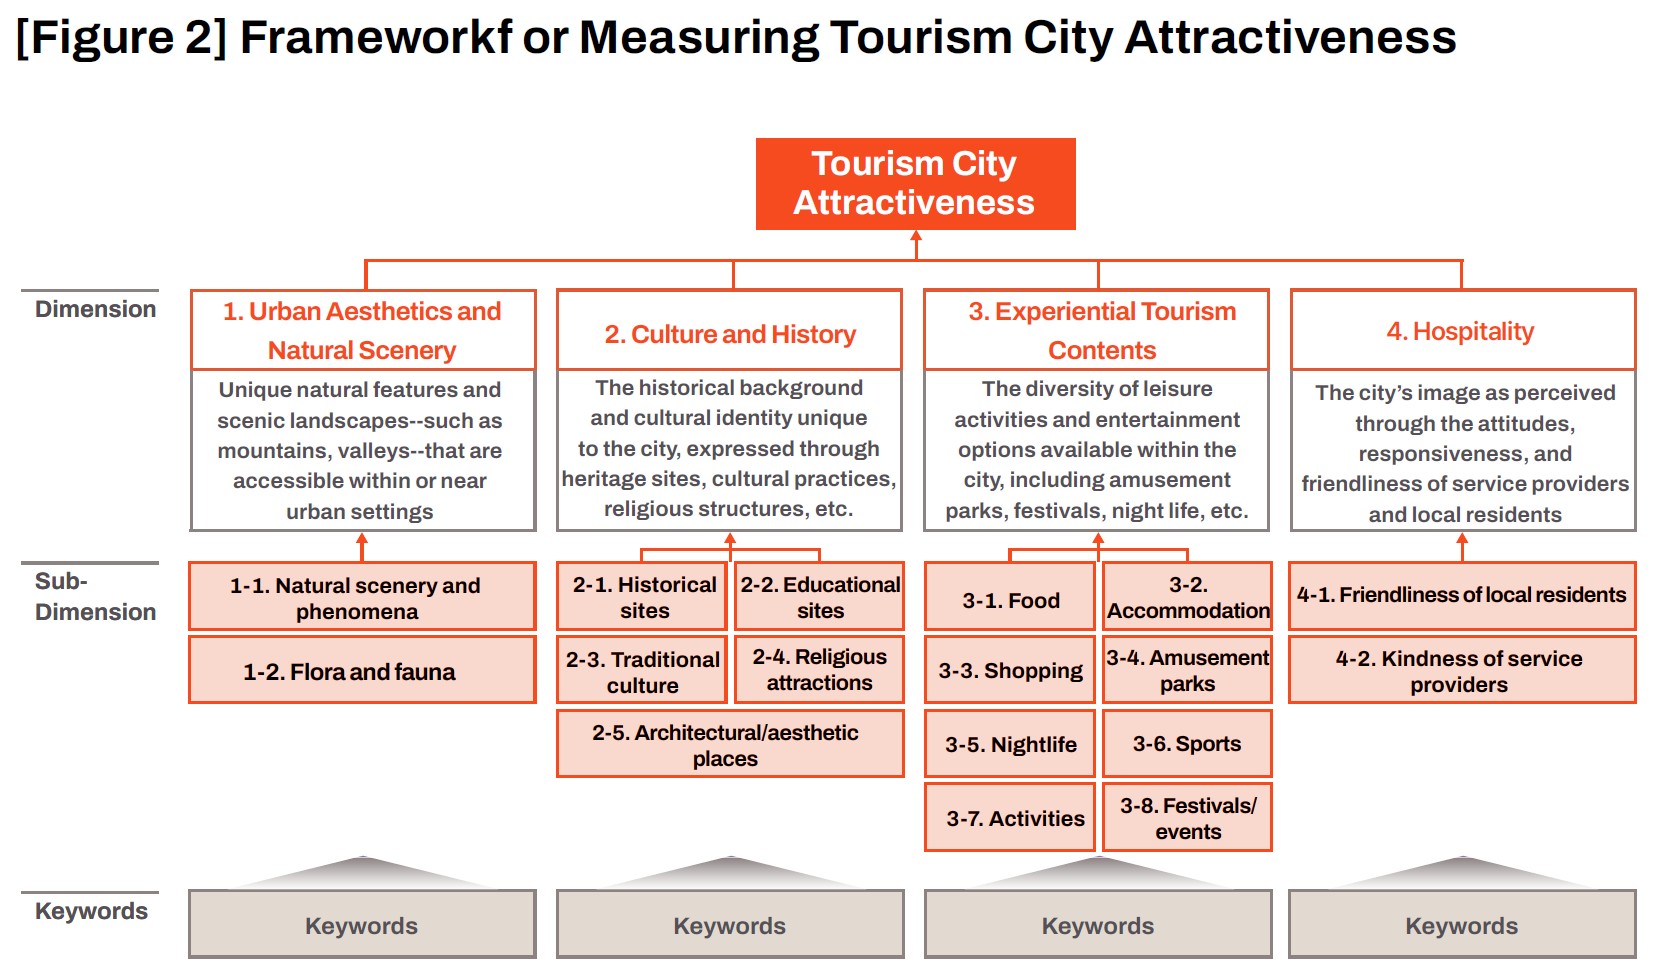
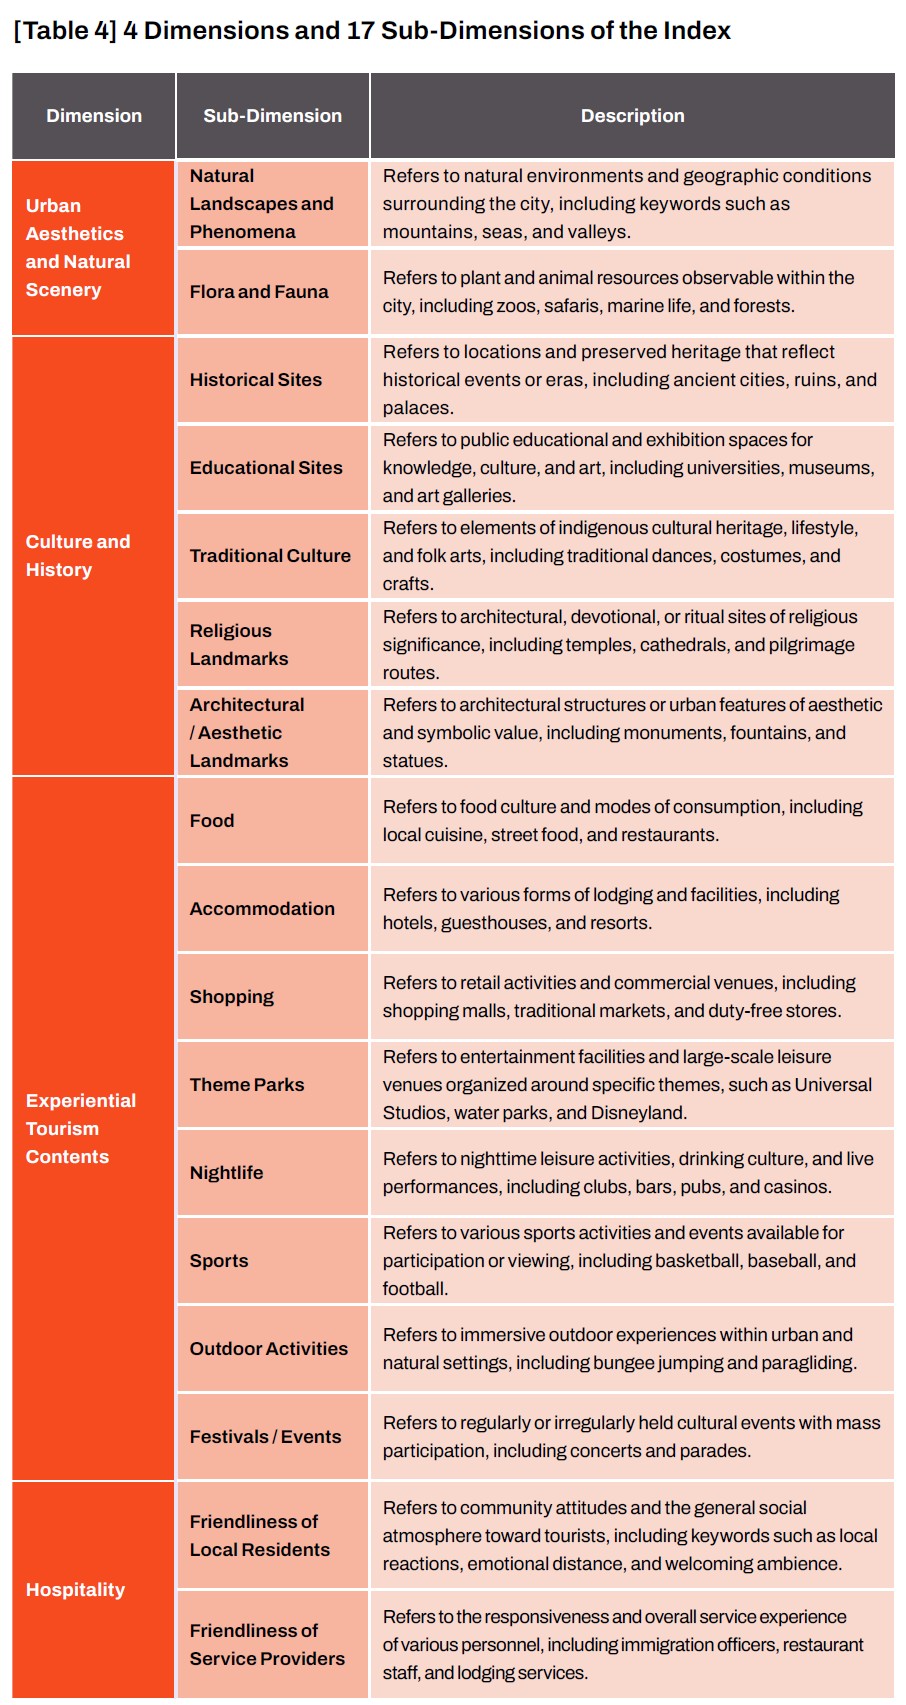
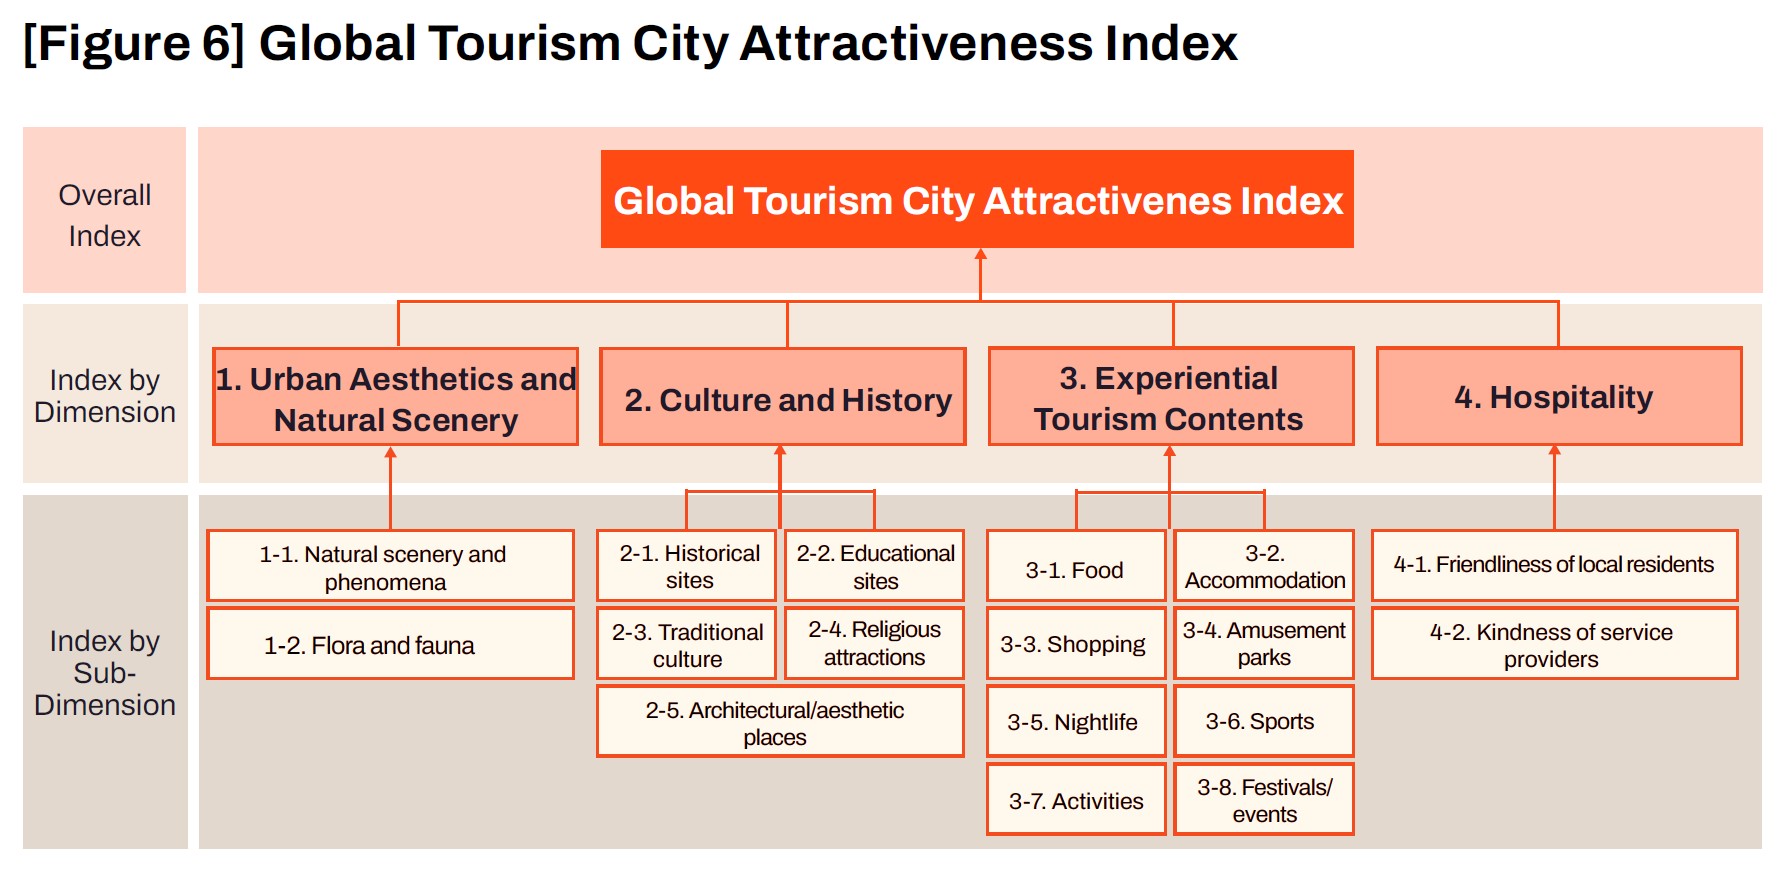
More specifically, the study operationalized attractiveness through four key dimensions and 17 sub-dimensions of tourism experience, with corresponding keyword libraries developed for each:
1. Urban Aesthetics and Natural Scenery (Weight: 30%) – Encompassing aesthetic qualities of the city and its surrounding natural environment, including subdimensions of natural scenery and phenomena and flora and fauna.
2. Culture and History (Weight: 30%) – Evaluating the city’s unique cultural heritage and historical depth, including historical sites, educational sites, traditional culture, religious landmarks, and architectural/aesthetic sites.
3. Experiential Tourism Contents (Weight: 30%) – Reflecting the modern tourist’s emphasis on enjoyment and stimulation through experience, including food, accommodation, shopping, theme parks, nightlife, sports, activities, and festivals/events.
4. Hospitality (Weight: 10%) – Capturing the sense of welcome perceived at the destination, divided into friendliness of local residents toward tourists and kindness of service providers.
This modeling approach overcomes the limitations of prior tourism evaluation studies, which often relied heavily on static statistical data or subjective assessments. By leveraging real-time social data, it enables dynamic analysis that more accurately reflects shifts in perceptions of cities as tourism destinations. Importantly, the structure of the index allows for comparability across global cities as well as longitudinal trend analysis, thereby providing valuable insights for policy formulation and destination brand strategy.
Measurement of Attractiveness by Dimension/Sub-Dimension/Overall
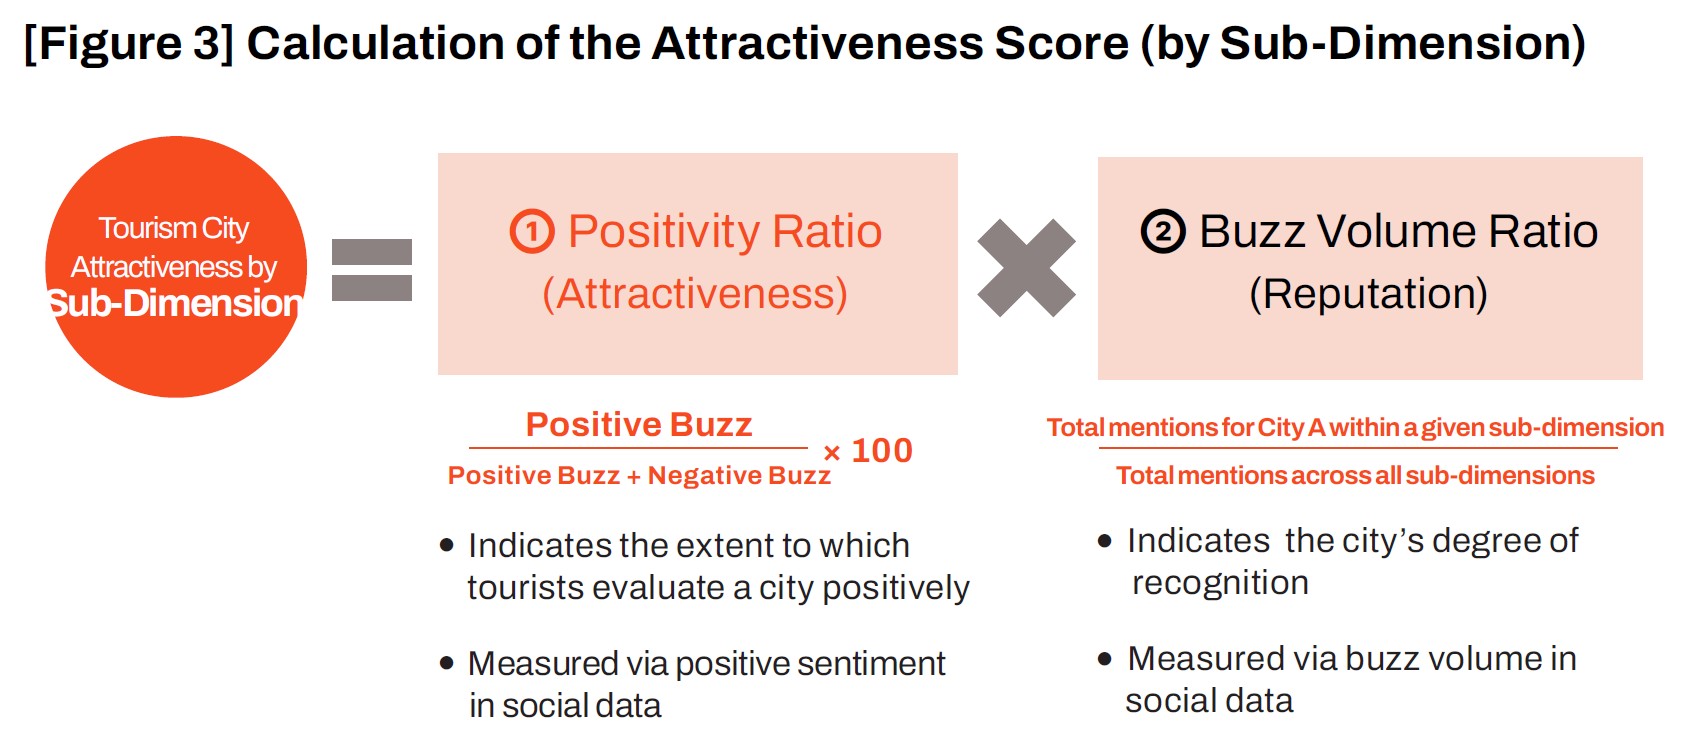
The measurement of attractiveness at the sub-dimension level was calculated by multiplying the positive sentiment ratio for a given keyword group by its relative share of total mentions. In other words, the score reflects both the extent to which tourists express positive evaluations of a given element and the degree to which that element occupies a significant position within the broader discourse on tourism.
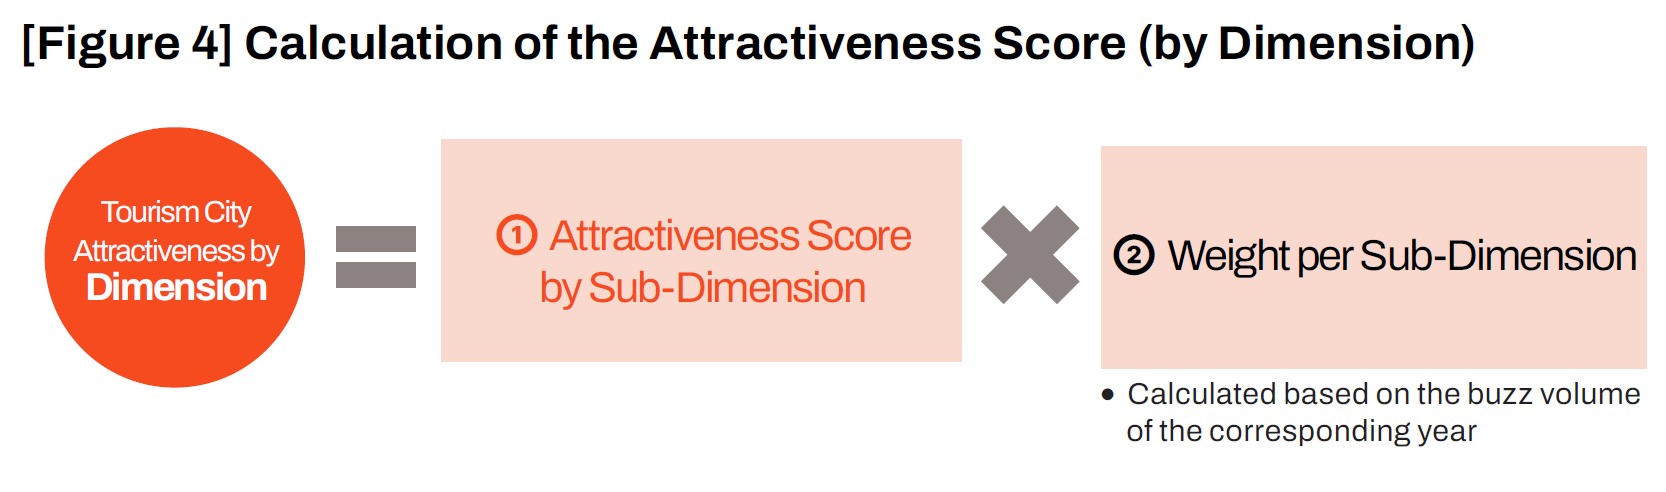
At the dimension level, the measurement approach acknowledged that subdimensions do not contribute equally to overall attractiveness. Sub-dimensions with higher levels of mentions were deemed to exert stronger influence in shaping
destination attractiveness. Accordingly, effective weights were assigned on the basis of annual buzz volume. That is, the attractiveness scores for each sub-dimension were weighted according to their relative mention frequency for the year, producing city-level attractiveness scores at the dimension level.
For the overall attractiveness index, each city’s final score was derived by applying the predefined weights to the four dimensions. As explained earlier, the four dimensions correspond to the core experiential elements of tourism: Urban Aesthetics and Natural Scenery (30%), Culture and History (30%), Experiential Tourism Contents (30%), and Hospitality (10%).
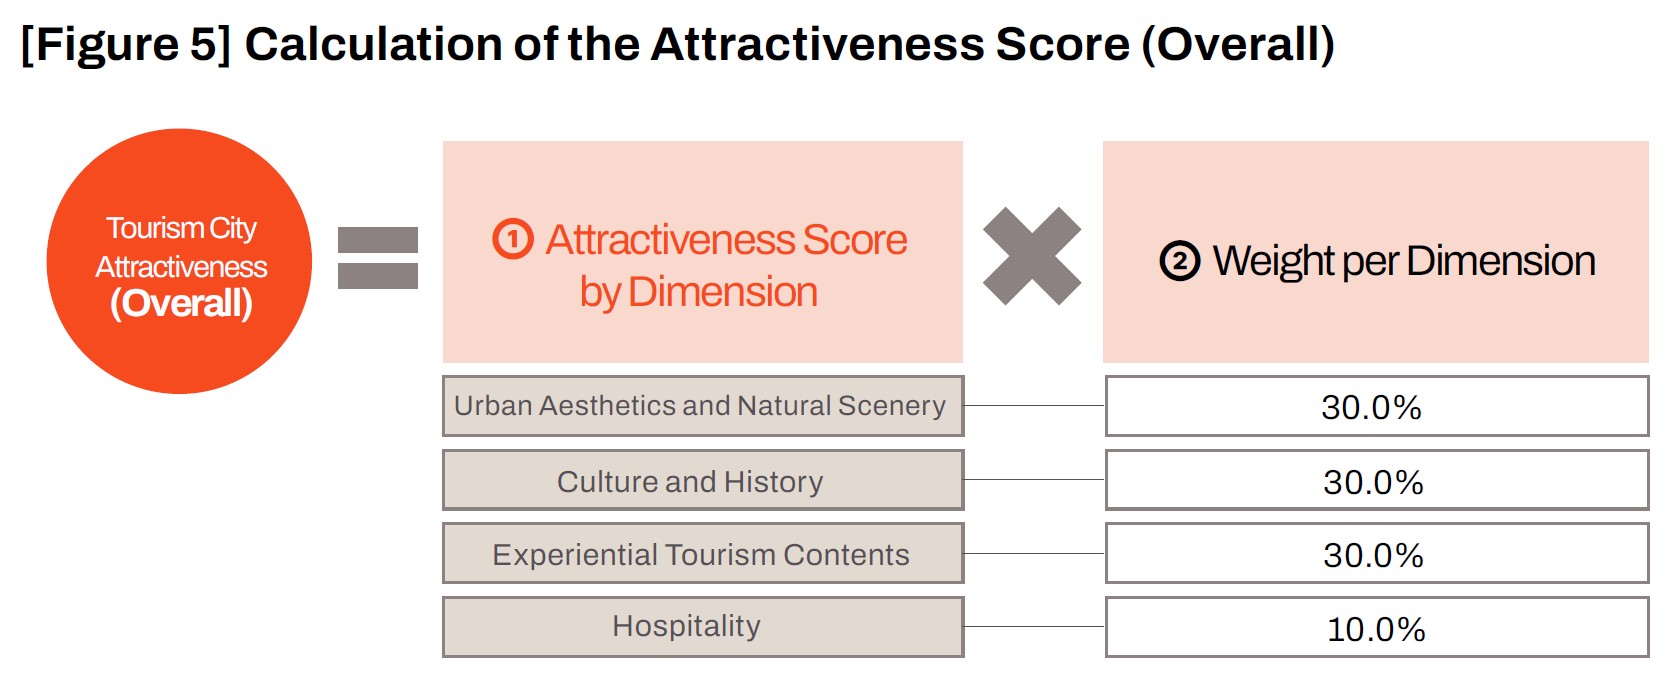
Finally, the results were standardized against global averages, with 2024 designated as the base year (Index = 100). This framework enabled the quantitative analysis of changes in attractiveness for each city in 2025 relative to 2024.
• Overall Index: Calculated as the average of city-level comprehensive attractiveness scores, this index aggregates tourism attractiveness across all cities at the highest level, serving as a benchmark for assessing global trends in tourism attractiveness.
• Dimension Index: Derived as the average of city-level scores at the dimension level, this index indicates the mean attractiveness associated with specific attributes (e.g., natural scenery, culture and history, experiential contents, hospitality).
• Sub-Dimension Index: Calculated as the average of city-level scores for each sub-dimension, this index provides a granular perspective on the constituent factors of attractiveness, enabling detailed tracking of changes in foundational elements of
tourism appeal.
This modeling approach overcomes the limitations of prior tourism evaluation studies, which often relied heavily on static statistical data or subjective assessments. By leveraging real-time social data, it enables dynamic analysis that more accurately reflects shifts in perceptions of cities as tourism destinations. Importantly, the structure of the index allows for comparability across global cities as well as longitudinal trend analysis, thereby providing valuable insights for policy formulation and destination brand strategy.
Evaluation Results of Global Tourism City Attractiveness
Based on the results of the Global Tourism City Attractiveness Index, the 191 cities were grouped into tiers. Cities ranked 1st to 50th were classified as the 1st Tier, those ranked 51st to 100th as the 2nd Tier, and those ranked 101st to 150th as the
3rd Tier. Cities ranked below 150th were designated as the Candidate Cities Group; their specific rankings will not be disclosed, but they will continue to be observed over time to track changes. The detailed rankings of the Top 50 cities are provided in the appendix of this report, while the full ranking can be accessed on the Yanolja Research website: (https://www.yanolja-research.com/brand/result?lang=en).
Viewed through the new lens of “attractiveness,” the global competitive landscape of cities reveals patterns that diverge significantly from conventional rankings based on visitor volume. Evaluations grounded in emotional affinity and word-of-mouth indicators show the emergence of new leaders while long-standing strongholds are confronted with novel challenges.
Performance and Trend Analysis of Top-Tier Cities
The 2025 global tourism city rankings reveal that top-tier success hinges on balancing the four pillars of at tractiveness—Experiential Tourism Contents, Culture and History, Urban Aesthetics and Natural Scenery, and Hospitality. Cities dependent on a single strength struggled to sustain their positions, whereas those with multidimensional appeal advanced.
Osaka rose from 3rd in 2024 to 1st in 2025, securing the top overall rank by excelling not only in Experiential Contents but also across Culture, Hospitality, and Natural Scenery. Paris retained its lead in Culture and History and held 2nd overall, though weaknesses in Hospitality remain. Kyoto, despite strong traditional culture and natural assets, slipped from 1st to 3rd due to weaker experiential offerings— highlighting the limits of relying on a single heritage advantage. Bangkok surged from
16th to 7th, evolving into a “balanced experiential city,” while emerging Southeast Asian destinations such as Chiang Mai and Nha Trang also gained ground. In contrast, Singapore declined across all dimensions, dropping from 8th to 15th.
Regionally, Asian cities were the standout performers. Japanese cities dominated the top tier, while Shanghai and Hong Kong rebounded to bolster Asia’s overall profile. Europe’s traditional hubs, however, faced stagnation or decline, with cities like Nice, Marseille, and Edinburgh falling, and only Paris sustaining a toptier rank. North American cities such as New York, Washington, and Los Angeles remained stable, while selected Canadian and South American cities advanced.
Korean destinations demonstrated particularly strong momentum. Seoul climbed to 5th place, driven by food, shopping, and improvements in natural scenery and hospitality. Jeju jumped from 23rd to 16th, leveraging its landscapes and marine activities, while Busan advanced to 23rd with a reinforced mix of coastal scenery, cuisine, and festivals.
The Four Pillars of Global Tourism City Attractiveness
Urban Aesthetics and Natural Scenery
In 2025, Japanese cities dominated this dimension, with Osaka, Kyoto, Okinawa, Fukuoka, Sapporo, and Tokyo all ranking in the top 15. Osaka rose to 1st, recognized for effectively blending natural and urban assets, while Kyoto slipped to 2nd but
remained symbolic of traditional beauty. Paris advanced to 3rd as its historic landscapes gained renewed recognition. Emerging Asian cities rose—Bangkok jumped from 23rd to 12th through ecological experiences and waterfront attractions,
while Hong Kong and Shanghai improved. Singapore, however, fell from 6th to 15th, reflecting the limits of engineered environments. Korean cities advanced: Seoul to 6th, Jeju to 7th, and Busan to 31st, leveraging natural and coastal appeal.
Culture and History
Paris and Kyoto led this dimension, with Paris climbing to 1st on its unmatched heritage and Kyoto falling to 2nd due to limited content diversity. Rome rose to 3rd, reaffirming its global prominence. Asian cities gained ground, with Bangkok soaring to 14th and Delhi and Chiang Mai advancing. U.S. cities such as Washington, Los Angeles, Chicago, and Boston strengthened their competitiveness. Among Korean cities, Seoul held 7th, Busan improved modestly, and Jeju advanced slightly with recognition of its historical sites and haenyeo culture.
Experiential Tourism Contents
Osaka retained 1st place, consolidating its status as an entertainment hub with dominance in theme parks, shopping, and nightlife. Seoul rose to 2nd on the strength of food and shopping, while Paris slipped to 3rd. Emerging Asian destinations—
including Bangkok, Chiang Mai, and Nha Trang—expanded rapidly. In the U.S., New York remained 4th, with Washington, San Francisco, and Las Vegas stable. European cities such as Rome, Barcelona, and Brussels declined. In Korea, Busan rose to 13th
and Jeju to 16th through stronger food, festivals, and activity-based offerings.
Hospitality
Osaka surpassed Kyoto to claim 1st, praised for its culture of kindness and service. Kyoto dropped slightly but remained near the top. Seoul maintained 3rd as a reliable hospitality leader. Bangkok surged from 20th to 7th, benefiting from service upgrades and cultural friendliness. U.S. cities, including New York, Washington, Boston, and Las Vegas, showed stable mid- to upper-tier performance, while most European cities stagnated. In Korea, Busan improved to 26th with gains in service-provider friendliness, while Jeju saw only marginal progress.
Shifts in the Index and Their Significance
Beyond the analysis of individual city rankings, the aggregated results of the Global Tourism City Attractiveness Index reveal macro-level dynamics of the global tourism market, transcending city-specific characteristics. Using 2024 as the baseline year (Index = 100), the analysis offers a strategic roadmap that highlights where travelers’ desires are directed and where future opportunities lie.
Recovery and Reconfiguration
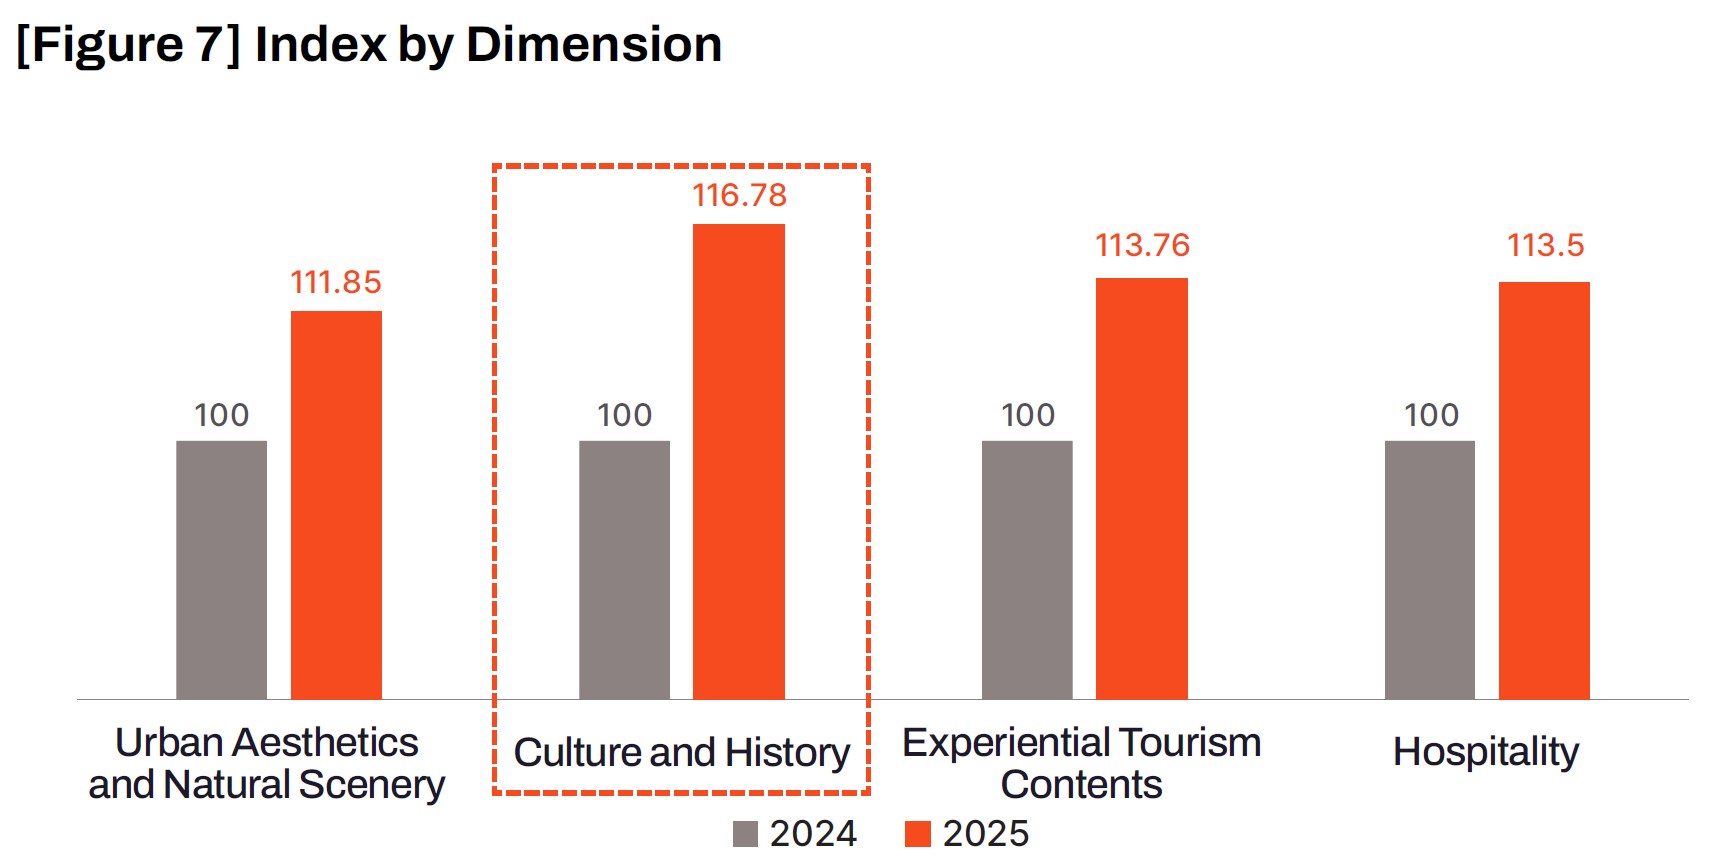
In 2025, the overall index reached 114.01, a 14.01% increase from 2024, confirming that global tourism has entered a robust recovery from the pandemic. Growth in attractiveness was evident across all four dimensions and 17 sub-dimensions,
underscoring that revitalization was broad-based rather than limited to certain regions or sectors. Crucially, this shift reflects not merely a return to pre-pandemic norms but a reconfiguration of travel priorities. Among the four dimensions, all grew by more than 10 percentage points, with Culture and History leading at 116.78, suggesting that travelers increasingly value meaningful and educational experiences through heritage and tradition.
Sub-Dimension Dynamics: Mapping Traveler Consumption Trends
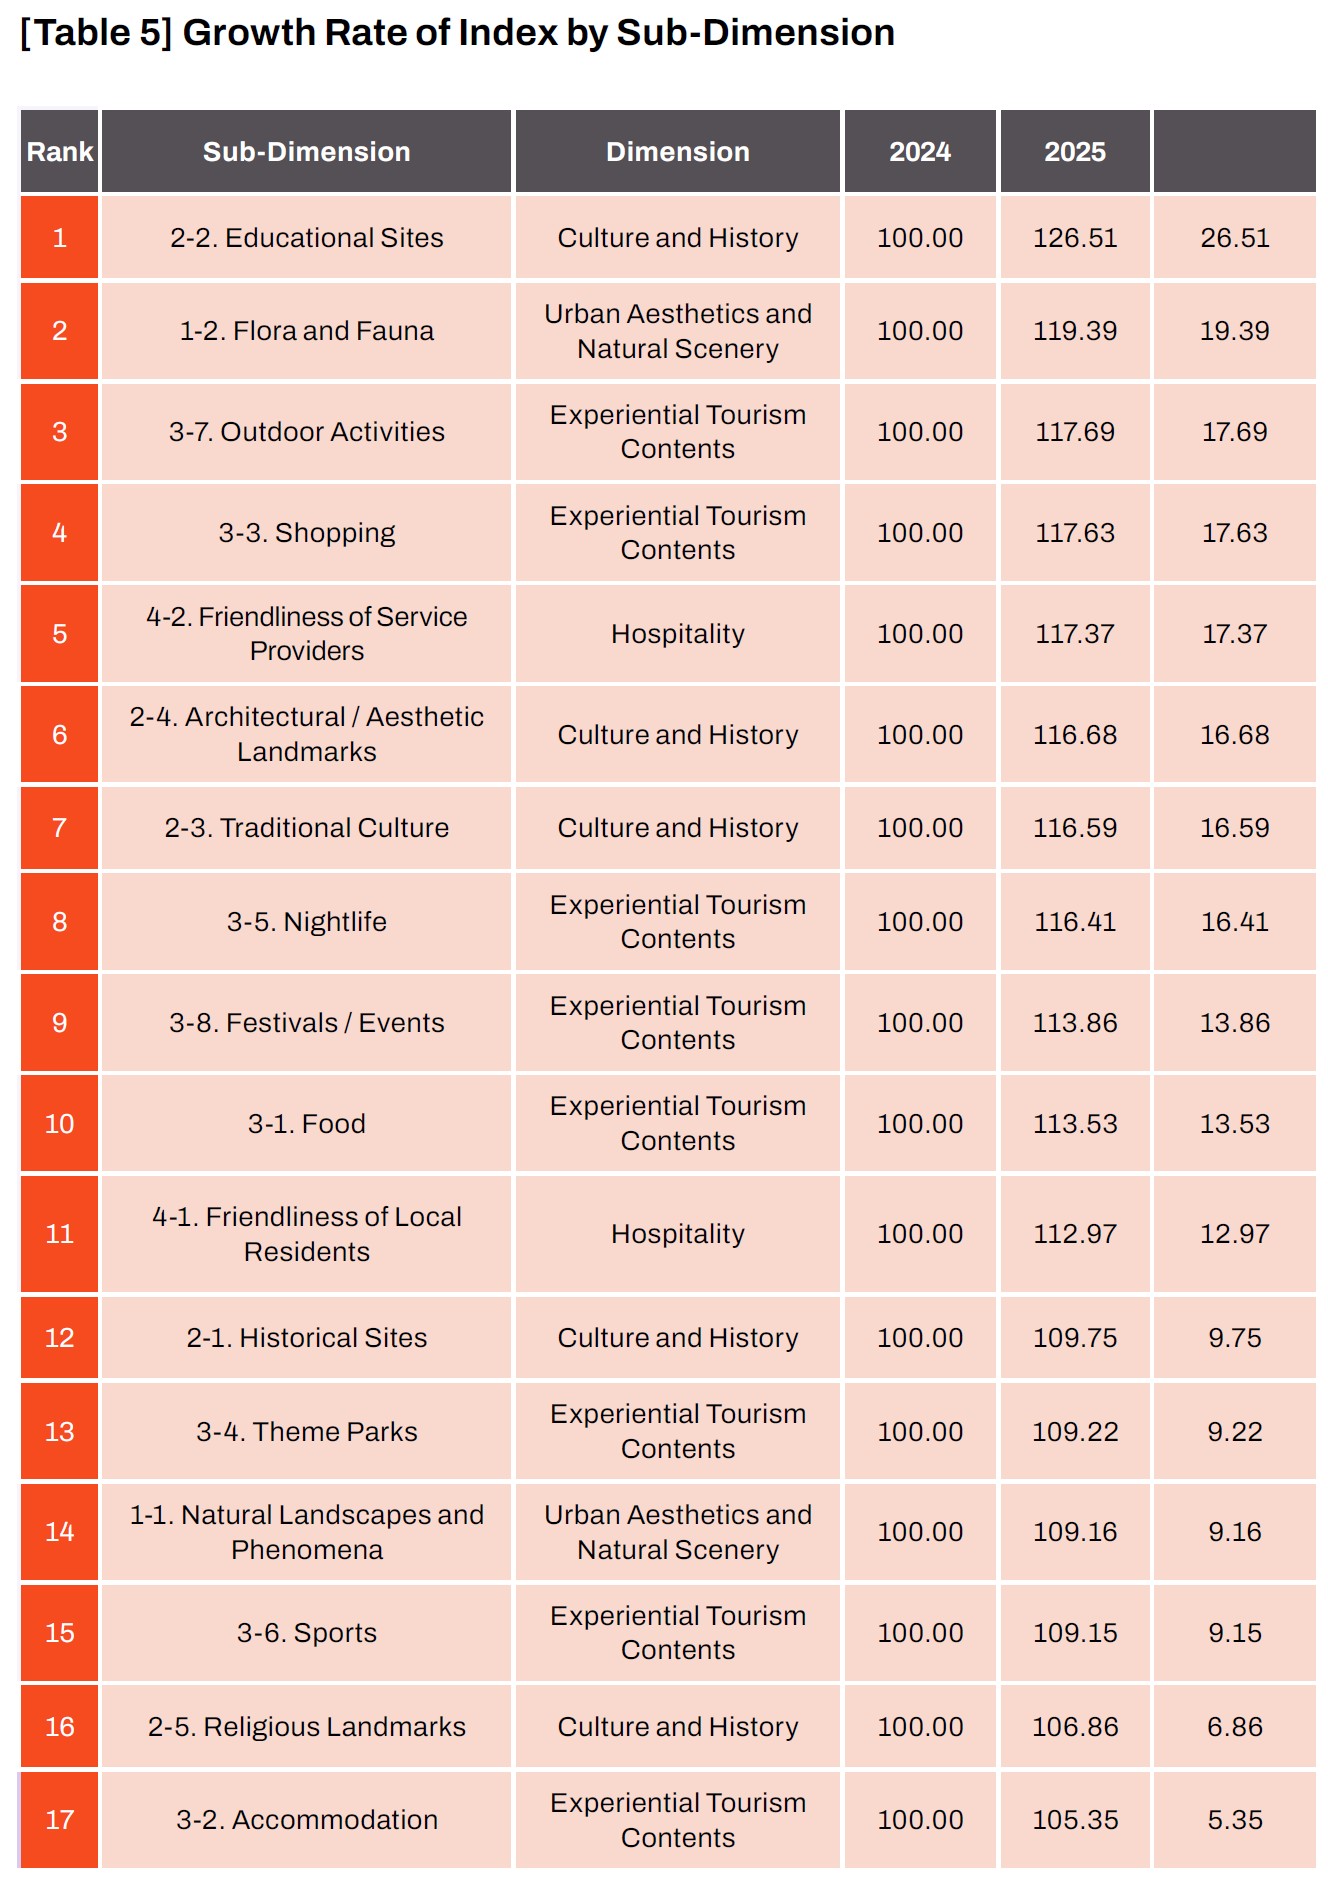
The most critical insights emerge from the changes across the 17 sub-dimensions, which reveal what travelers are truly enthusiastic about, where they invest their time and money, and what experiences they share online. Two transformative trends stand out: the commodification of the stay and the premiumization of the experience.
• Commodification of the Stay: Positive attention toward Accommodation grew only 5.35%, the lowest among all sub-dimensions. Clean and comfortable lodging remains essential, but it no longer delivers emotional impact or share-worthy s tories—making accommodation a hygiene factor: necessary but insufficient to enhance urban attractiveness.
• Premiumization of the Experience: By contrast, the strongest growth came from active and participatory categories. Educational Sites surged 26.51%, showing tourism’s evolution into a tool for learning and selfdevelopment. Flora and Fauna (19.39%) reflected the biophilia trend, while Activities (17.69%) and Shopping (17.63%) confirmed persistent demand for stimulation and escape through experiential engagement.
Collectively, these patterns signal a decisive shift in tourism value creation—from where one sleeps to what one does—with profound strategic implications for hospitality. The hotel of the future must evolve into an experience platform connecting travelers with distinctive local opportunities, as its brand value and profitability will hinge on guiding guests toward high-growth experiential categories.
In conclusion, the 2025 global tourism trends can be summarized as: intensification of learning- and experience-oriented travel, the rise of nature-based experiences, expansion of participatory and nighttime consumption, and heightened sophistication in service quality.
Recommendations for the Tourism Industry
The Global Tourism City Attractiveness Index is not merely a report card but a strategic action plan for shaping the future of cities. The insights provided by the data function as a playbook that translates diagnosis into action, offering differentiated yet interconnected agendas for city governments, Destination Marketing Organizations (DMOs), and the private sector.
A Policy Compass for DMOs and Policymakers
• Precision Targeting Strategies: Policymakers must move beyond broad, indiscriminate marketing toward data-driven, targeted interventions. For example, if Kyoto’s decline in the 2025 rankings is not due to weakened traditional culture but
rather to underperformance in Experiential Tourism Contents, then the Kyoto city government should not simply increase budgets for temple promotions. Instead, it should prioritize investments in complementary modern entertainment, activities, and nighttime economy initiatives. In this way, the index functions as a resource allocation map, identifying where limited resources can generate maximum impact.
• Evidence-Based Policy Evaluation: The annually published index enables objective measurement of the return on investment (ROI) of tourism policies. For instance, if a city launches a large-scale “urban service improvement campaign,”
changes in the following year’s scores under the Hospitality dimension—particularly the sub-dimension of service-provider friendliness—can empirically validate the campaign’s effectiveness. This creates a virtuous cycle where policy successes and
failures are assessed transparently, and future strategies are designed with greater precision.
• Competitive Benchmarking for Advantage: The index allows cities not only to track global rankings but also to benchmark against direct competitors on specific attributes. For example, a city aiming to position gastronomy as its key growth driver should benchmark not against geographically proximate cities, but against global leaders such as Seoul or Osaka, which score among the highest in the Food subdimension. Deep analysis of their success factors, followed by reinterpretation and adaptation to local culinary culture, can yield more competitive strategies.
An Innovation and Growth Roadmap for the Private Sector
• Market-Demand-Oriented Product Development: Industry players must focus resources on what travelers truly value. The 2025 analysis highlights explosive increases in positive attention toward Educational Sites (+26.51%), Shopping
(+17.63%), and Activities (+17.69%). This provides a clear market signal for travel agencies, hotels, and airlines to develop offerings such as in-depth museum tours, specialized shopping packages, and adventure sports products. Conversely, the
relatively weak growth of Accommodation (+5.35%) indicates that improving room quality alone cannot serve as a differentiation strategy. The hospitality sector must instead design packages that link lodging with high-growth experiential contents, transforming accommodation from a mere stay into an integral part of the overall experience.
• Data-Driven Service Innovation: The Hospitality dimension provides direct feedback to the tourism industry. If a city scores low on service-provider friendliness, this constitutes compelling evidence for local hotel and restaurant associations to invest in staff training programs. Such scores transcend individual company reputations, as they directly shape the overall attractiveness of the city. The data demonstrate that service quality improvement is no longer optional—it is an essential
investment for the survival and competitiveness of the tourism industry.
• Authentic Marketing Communication: Differentiated communication strategies are required, aligned with the attractiveness–reputation matrix. Cities identified as “hidden gems” (high attractiveness, low reputation) should highlight their strong attractiveness scores by showcasing genuine visitor reviews and evaluations at the forefront of campaigns. User-generated content (UGC) is more effective than influencer marketing in building trust. Conversely, cities diagnosed as “overhyped” (low attractiveness, high reputation) should move away from broad awareness campaigns. Instead, they should focus on spotlighting specific experiences that genuinely receive high visitor evaluations (e.g., a celebrated food district or a hidden cultural landmark). This represents a shift from one-way messaging (“our city is great”) to evidence-based storytelling (“this experience in our city is truly loved by visitors”).
Conclusion: The Future of Tourism Depends on the City’s Attractiveness
The Global Tourism City Attractiveness Index provides an objective lens to evaluate cities’ competitive advantages and to guide sustainable tourism development, marking a paradigm shift from quantity to quality and from visitor numbers to
experiential value. As the first consumer-centered tool, it functions not only as a ranking system but also as a shared language for policymakers, DMOs, and industry stakeholders to collaborate in enhancing traveler experiences.
Methodologically, the study innovates by converting travelers’ subjective perceptions into quantifiable indicators through large-scale social data analysis, thereby overcoming supply-side limitations and placing tourists’ psychological evaluations at the core of tourism policy.
Ultimately, the index fosters constructive competition: when one city improves service quality in response to hospitality feedback, and another strengthens experiential offerings, the entire global tourism ecosystem benefits. In the future, the most successful cities will not be those with larger infrastructure, but those that resonate more deeply and durably in travelers’ hearts—signaling the significance of this study as the first compass to measure such sentiments.
To reference this article, please use the following citation: “SooCheong Jang, Kyuwan Choi, Hyo Won Yoon. (2025), Yanolja Attractiveness Index: Understanding a Metric for Measuring the Attractiveness of Global Tourism Cities, Yanolja Research Insights, Vol. 30.”
References:
Crompton, J. L. (1979). Motivations for pleasure vacation. Annals of Tourism Research, 6(4), 408–424.
Dann, G. M. S. (1977). Anomie, ego-enhancement and tourism. Annals of Tourism Research, 4(4), 184–194.
Gartner, W. C. (1994). Tourism and travel in the new Europe. CAB International.