Deachul (David) Seo, Senior Researcher, Yanolja Research / [email protected]
Suckwon Hong, Principal Researcher, Yanolja Research / [email protected]
Yejin Ahn, Senior Researcher, Yanolja Research / [email protected]
Tourism has become a core industry that not only drives national economies but also shapes the image and identity of cities in the contemporary global landscape. In particular, Northeast Asia has emerged as a dynamic hub for international tourism, offering a rich tapestry of historical heritage, distinctive cultural assets, and rapid urban development. Countries such as South Korea, Japan, China, and Taiwan—while geographically proximate and culturally intertwined—have adopted distinct strategies and content portfolios to attract Western tourists, thereby intensifying regional competition.
Key metropolitan centers—Seoul and Busan (South Korea), Tokyo and Osaka (Japan), Beijing and Shanghai (China), and Taipei and Kaohsiung (Taiwan)—serve as primary gateways for inbound travelers. Understanding the structure and reception of tourism offerings in these cities is thus essential for evaluating their competitive positioning and strategic differentiation in the global tourism market.
Against this backdrop, the present study conducts a data-driven analysis of tourism products listed under the “Things to Do” category on TripAdvisor, focusing on the aforementioned eight cities. TripAdvisor serves not merely as a review platform but also as a real-time barometer of Western tourists’ perceptions, experiences, and preferences. As of 2024, the platform hosts approximately 12.46 million tourism product listings and over 31.1 million reviews contributed by more than 21.1 million users. According to the 2025 Transparency Report, 50.0% of users reside in Europe, 22.9% in the Americas, and 16.6% in Asia—underscoring the platform’s reliability for gauging Western consumer sentiment.
This study utilizes TripAdvisor data to quantitatively analyze tourism products through thematic classification and performance metrics. Products were categorized using BERTopic, a topic modeling algorithm capable of clustering textual data (e.g., titles and descriptions) into coherent themes. These clusters—such as "local cuisine," and "traditional culture"—enable cross-city comparisons of tourism content. Key consumer response indicators—including price, rating, and review count—were then analyzed to examine how each city’s products are consumed and evaluated by Western tourists.
By moving beyond macro indicators such as tourist arrivals and revenue, this study contributes to an understanding of qualitative competitiveness, emphasizing the composition of tourism content and the depth of consumer engagement.

Using data from TripAdvisor, this study examined the structure of tourism product offerings and consumer responses for each city. Key indicators such as the number of products and price levels provide a basic understanding of market scale and pricing structure, while review counts and ratings function as proxies for actual user experience and word-of mouth engagement.

Based on the number of registered tourism products, Tokyo (2,487 items) and Beijing (2,270 items) offered the largest inventories, followed by Shanghai (1,257), Seoul (898), and Osaka (651). In contrast, Busan (233), Taipei (317), and Kaohsiung (43) had relatively limited offerings. Notably, Kaohsiung’s product count amounts to only 1.7% of Tokyo’s, indicating a markedly lower diversity of tourism products.

Price Distribution and Market Strategy
Tourism product pricing varied significantly across cities. Cities like Seoul and Taipei emphasized affordability and mass accessibility through a concentration of lower-priced, “budget” offerings, appealing to a broader tourist base. Conversely, cities such as Tokyo, Beijing, and Kaohsiung exhibited a high proportion of premium-priced products, positioning themselves toward high-value experiential markets. Meanwhile, Busan, Osaka, and Shanghai primarily offered mid-range products, targeting a stable and diverse consumer base through a balanced portfolio.
Seoul had the lowest median price (USD 96.25) and first quartile (USD 63.73), reflecting its strategy of maximizing accessibility. However, the standard deviation (USD 827.61) was the highest among all cities, and the maximum price reached USD 8,790—pulling the average price up to USD 286.63. This suggests a dual strategy in which Seoul caters to both price-sensitive tourists and those seeking premium experiences.
Similarly, Taipei maintained a stable low-price structure, with an average of USD 220.70, a median of USD 105, and a relatively low maximum of USD 3,659. This aligns with a strategy to attract a wide range of visitors through economic accessibility.
Busan, Osaka, and Shanghai all posted similar average prices (USD 265–267), and the relatively narrow gap between median and mean prices indicates a market dominated by mid-priced offerings. Notably, Busan had the lowest standard deviation (USD 410.67) but the widest interquartile range (USD 246.38), suggesting strong diversity within a stable pricing band.
On the other hand, Tokyo, Beijing, and Kaohsiung all recorded average prices above USD 300. Tokyo had the highest maximum price at USD 15,399 and a high standard deviation of USD 784.10, indicating a broad spectrum of offerings—from mass-market to ultra-premium. Beijing's pricing structure was skewed upward across all quartiles, while Kaohsiung had the highest average price (USD 393.23) despite its limited product count, requiring cautious interpretation.
Consumer Response to Tourism Products
Review counts and ratings are core indicators of product quality and consumer satisfaction in the tourism market. These metrics go beyond simple purchase records, capturing the emotional and participatory responses of travelers. The number of reviews reflects a product’s exposure and its ability to meet or exceed expectations. A high review count suggests strong motivation among tourists to share their experiences, implying greater potential for repeat visits and peer recommendations.
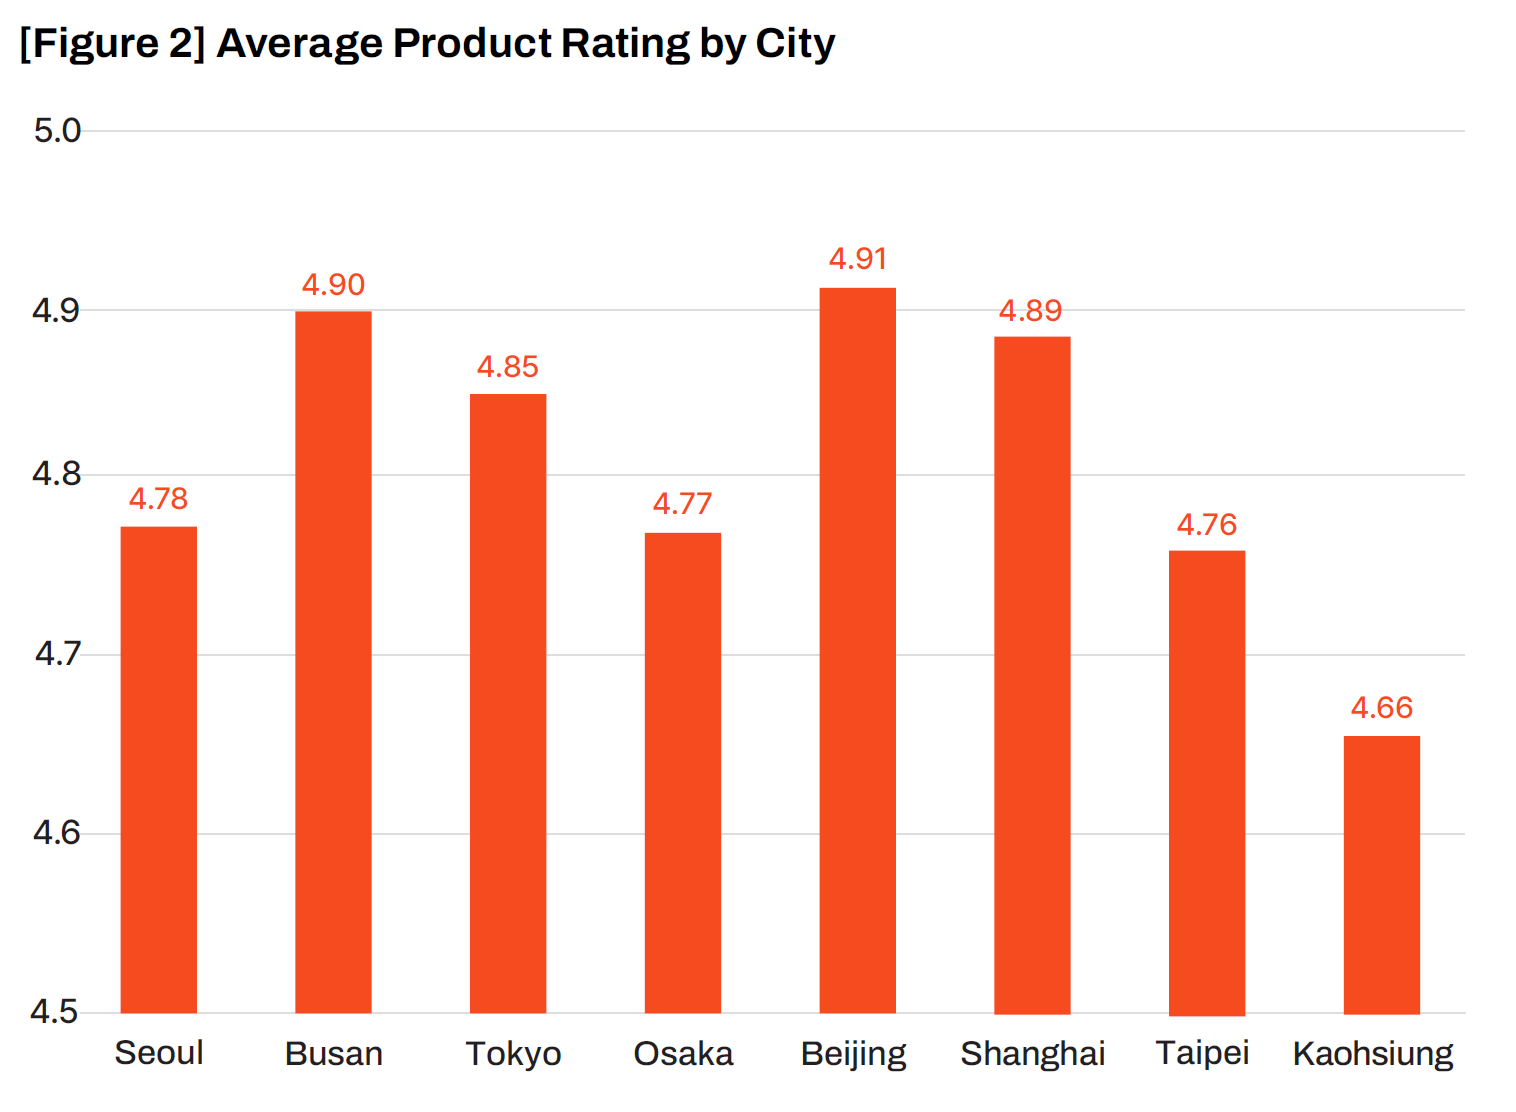
Ratings, on the other hand, offer a quantifiable measure of user satisfaction. The average rating for each city does not merely indicate overall urban appeal, but more precisely reflects the consistency of quality and alignment with tourist expectations across the product portfolio. A high average rating implies that the city reliably delivers quality experiences and may serve as an indicator of strategic success in tourism development.

Seoul, Tokyo, and Taipei showed high levels of consumer engagement, with 53.34%, 50.74%, and 48.26% of their listed tourism products, respectively, having received reviews on TripAdvisor. This suggests that these cities effectively stimulated interest and a desire to share experiences among Western tourists. Notably, Seoul recorded the highest average number of reviews per product (156.71) and the highest single-product review count (25,333), indicating the strongest consumer response among all cities. This implies that Seoul’s tourism offerings achieved high visibility and met tourists’ expectations effectively.
However, in terms of satisfaction, Seoul’s average rating (4.78) was relatively lower than those of Tokyo (4.85), Beijing (4.91), and Shanghai (4.89), suggesting a need for improvement in experience quality. While Seoul’s rating is not low in absolute terms (on a 5-point scale), the meaningful gap compared to competing cities underscores the importance of consistent quality management and differentiated experience design.
Tokyo demonstrated strengths in both review participation (50.74%) and average rating (4.85), indicating its ability to maintain consistent quality and satisfaction across a wide price spectrum. This suggests that Tokyo effectively targets a broad range of consumers with a well-balanced product portfolio. Beijing, although showing a lower review ratio (40.93%) compared to Seoul and Tokyo, achieved the highest average rating (4.91), reflecting particularly positive evaluations—likely attributed to high satisfaction with symbolic heritage sites such as the Great Wall and the Forbidden City.
Busan (42.49%) and Osaka (42.24%) recorded slightly lower review ratios than Seoul, Tokyo, and Taipei, but still demonstrated active consumer response across more than 40% of their products. In particular, Busan maintained a high average rating of 4.9 despite having fewer reviewed products (99) and a relatively low average review count (36.44), indicating stable satisfaction across a mid-range product portfolio. This suggests that regionally distinctive content, such as Gamcheon Culture Village, left a strong impression on visitors. Beijing also recorded a strong average rating of 4.91, reaffirming its favorable reception.
In contrast, Shanghai (24.74%) and Kaohsiung (29.91%) had review participation rates below 30%, indicating relatively low consumer engagement. In Shanghai’s case, despite offering unique content such as water towns, the low review participation rate points to the need for strategies to activate consumer feedback. For Kaohsiung, with only 43 products listed in total, the limited data suggests that expanding product diversity remains an urgent task.
Comparative Analysis of Tourism Product Themes by City
The previous sections provided a foundation for understanding the quantitative aspects of tourism supply and consumer satisfaction across cities. However, to grasp the qualitative distinctions and strategic orientations of each city, it is essential to conduct a thematic analysis using BERTopic modeling. This approach enables the classification of thousands of tourism products into topic clusters that reveal how tourism content is organized and differentiated at the city level.

In Seoul, for example, among 898 tourism products, the most prominent themes were “Outskirts Tours” (35.4%), “Traditional Culture” (17.6%), and “Local Cuisine” (10.0%). The “Local Cuisine” cluster includes premium offerings, such as nationwide culinary tours featuring Jeju, Gyeongju, and DMZ sites, with average prices exceeding USD 1,000. Core strengths of Seoul’s portfolio lie in its ability to integrate accessible excursions to nearby regions like northern Gyeonggi Province (DMZ) and Gangwon Province (Nami Island), as well as in leveraging traditional cultural assets. The city offers a multi-layered product structure that spans from budget-friendly to ultra-premium experiences, demonstrating its strategic intent to appeal to a broad spectrum of Western tourists.

Busan, with 233 tourism products, showed a narrower supply but emphasized distinct local appeal. The dominant themes were “City Tours and Landmarks” (35.2%) and “Outskirts Tours” (18.9%), focusing on experiences such as Gamcheon Culture Village, Jagalchi Market, and day trips to Gyeongju and Geoje. Busan’s portfolio combines “Local Cuisine” and “Traditional Culture” in a way that captures Korea’s regional identity, delivering meaningful experiences despite a smaller product base. This structure illustrates the city’s ability to offer a diverse yet focused range of products that effectively convey its cultural uniqueness.
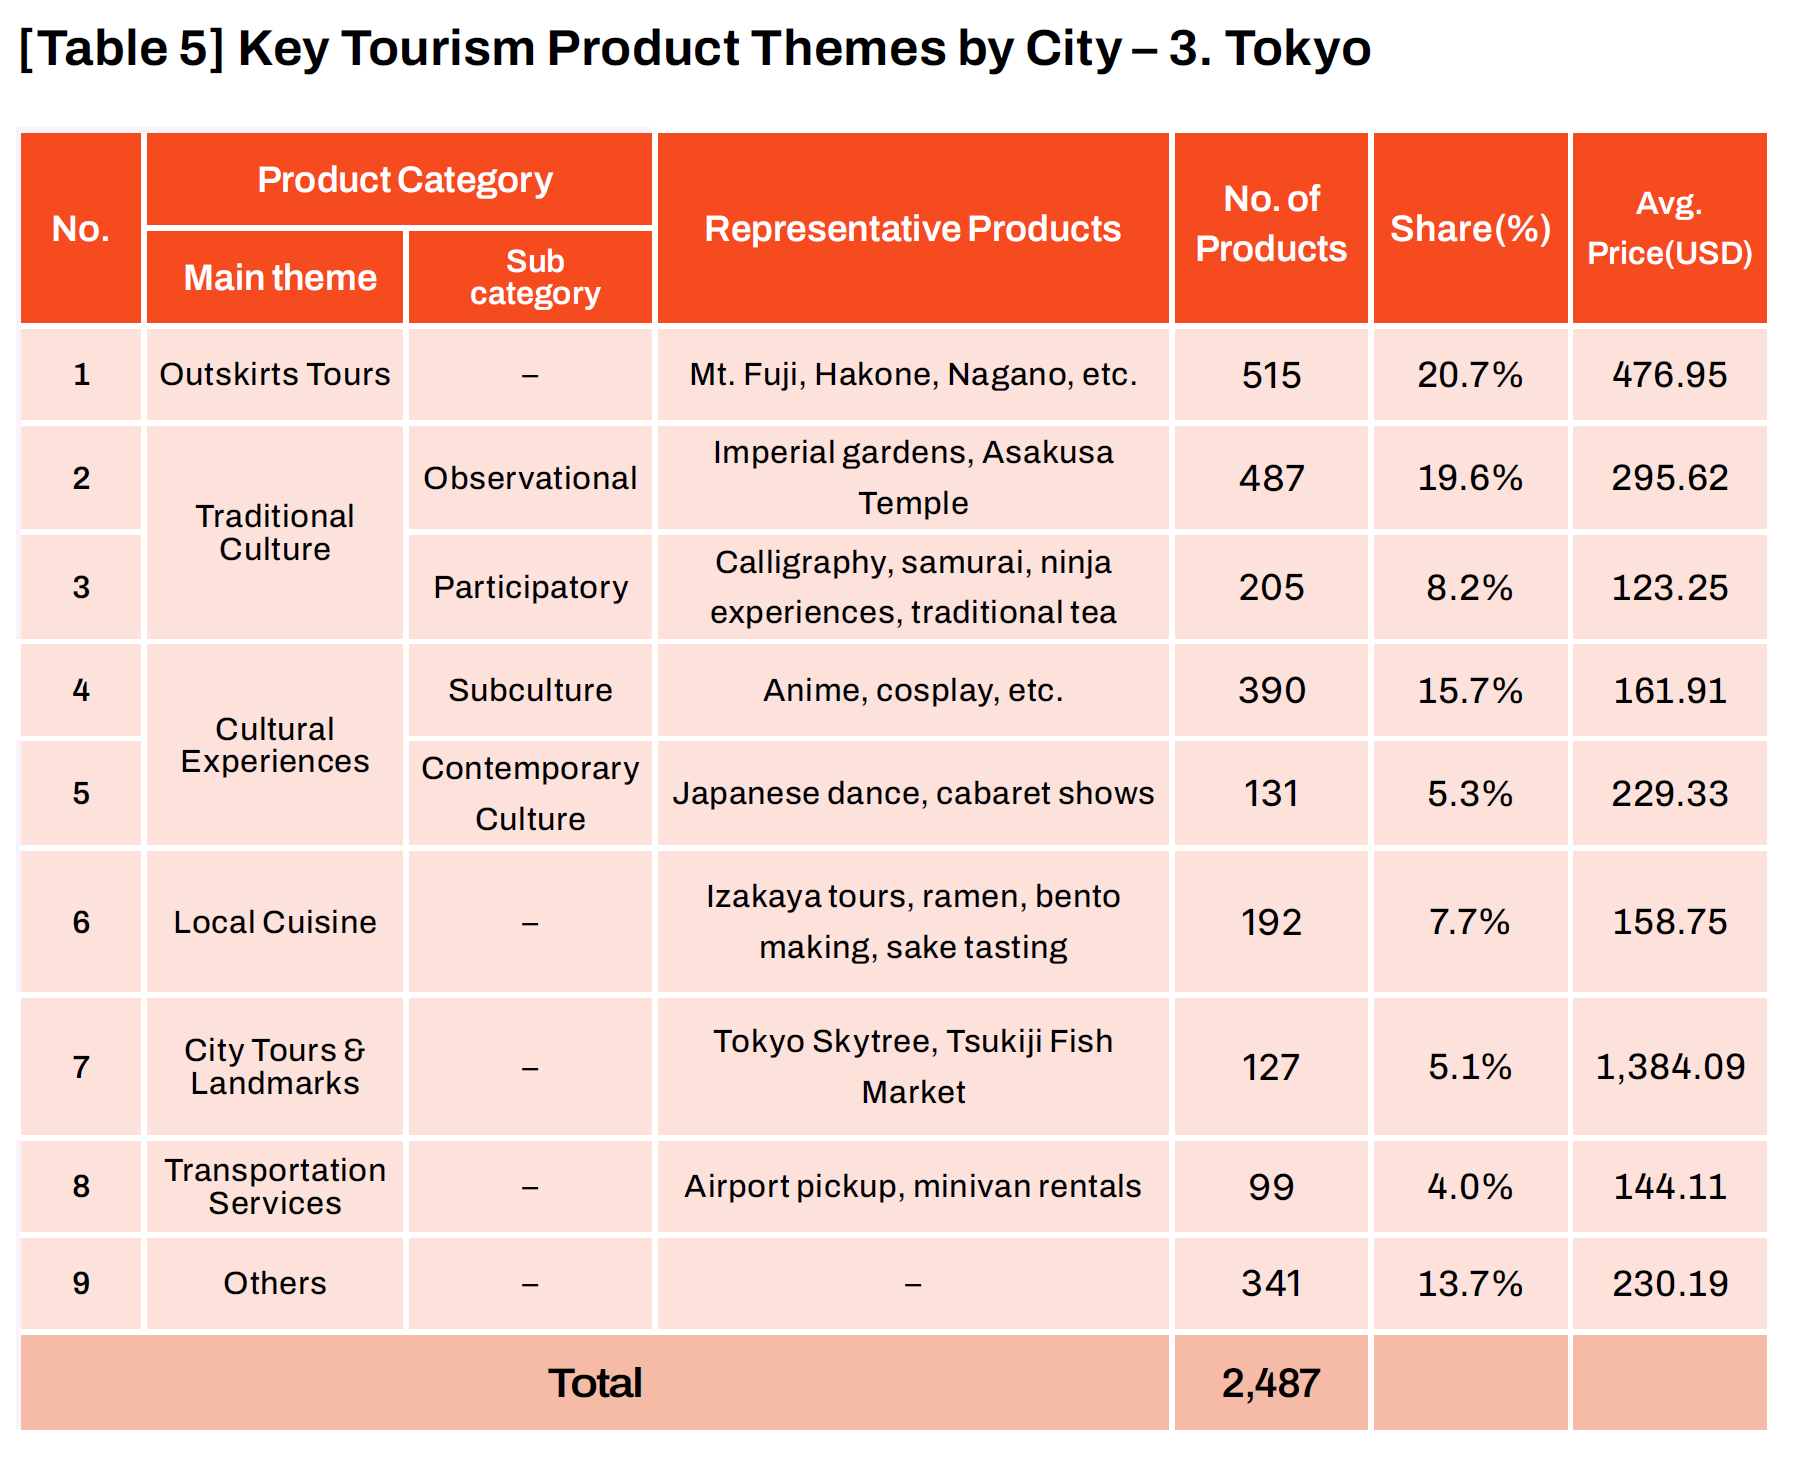
Tokyo, with 2,487 products, presented the most balanced portfolio among all cities. The top categories included “Traditional Culture” (27.8%), “Cultural Experiences” (21.0%), and “Outskirts Tours” (20.7%). The “Traditional Culture” theme was further divided into observational experiences (e.g., imperial gardens, temples) and participatory content (e.g., calligraphy, samurai lessons). The “Cultural Experience” category featured contemporary subcultures, such as anime and cosplay, underscoring Tokyo’s strength in leveraging modern cultural assets. The multi-dimensional structure demonstrates Tokyo’s ability to integrate tradition and modernity while satisfying diverse tourist interests.

Osaka, with 651 products, was dominated by “City Tours and Landmarks” (51.5%), followed by “Local Cuisine” (18.7%) and “Outskirts Tours” (16.0%). Regional excursions to Kyoto and Nara were priced above USD 500 on average, positioning Osaka as a provider of high-value day trips. Transport-related services also reflected a premium structure. This indicates that Osaka employs a differentiated strategy combining dense urban experiences with regional mobility to appeal to premium tourists.

Beijing, with 2,270 products, focused on “Outskirts Tours” (36.8%) and “City Tours and Landmarks” (15.4%), with heavy emphasis on iconic heritage sites such as the Great Wall and the Forbidden City. Some extended “Intercity Tours” involving cities like Xi’an and Shanghai averaged over USD 2,100, forming a high-end segment**. These packages highlight Beijing’s strategic use of regional networks and symbolic assets to deliver in-depth, premium experiences.

Shanghai’s 1,257 products centered on “Outskirts Tours” (19.3%) and “Traditional Culture” (16.3%), particularly emphasizing water towns like Zhujiajiao. “Intercity Tours” accounted for 11.1% of offerings and averaged nearly USD 960, placing them in the premium category. The city also featured a high number of transport-related services (e.g., port and airport transfers), reflecting its accessibility-oriented structure. Shanghai’s content strategy combines cultural depth with modern infrastructure to offer layered experiences.

Taipei, with 317 products, concentrated heavily on “City Tours and Landmarks” (37.9%) and “Outskirts Tours” (29.4%). The content focused on emotional and scenic themes—such as Jiufen, Shifen, and Yangmingshan—highlighting the city’s tranquil and nostalgic atmosphere. Though “Intercity Tours” were limited in volume, they showed high average prices (USD 1,138), indicating potential for high-value product development. Taipei’s structure blends urban icons with nature-based excursions, forming a portfolio with distinct emotional appeal.

Kaohsiung, with only 43 products, had a significantly limited inventory. However, the average price of “Outskirts Tours” was relatively high (USD 867), featuring regional links to Tainan and Liuqiu Island. Due to its limited data, caution is required in interpreting results, but the findings suggest an emphasis on premium-linked products rather than volume.
Differentiation in Tourism Product Composition Across Cities
A comparative analysis of tourism product composition reveals distinct strategies and competitive positioning among Northeast Asian cities. Seoul and Beijing exhibit the highest proportions of “Outskirts Tours”, at 35.4% and 36.8% respectively. These cities employ an expanded content structure that leverages both central and peripheral regions, forming what can be conceptualized as a hub-and-spoke model. In this framework, the urban core serves as a gateway (hub) to more immersive, often rural or historical experiences in nearby areas (spokes)—such as northern Gyeonggi Province and Nami Island in Seoul, or the Great Wall and Xi’an in Beijing. This structure enhances the depth of tourist engagement by integrating the accessibility of the city with the richness of its surroundings.
In contrast, cities such as Busan, Osaka, Taipei, and Kaohsiung are characterized by content structures centered on “City Tours and Landmarks”. Notably, Osaka (51.5%) and Kaohsiung (60.0%) exhibit concentrated, linear compositions focused on high-density urban experiences. These cities effectively utilize walkable attractions within the city—such as Gamcheon Culture Village (Busan), Dotonbori (Osaka), and Jiufen (Taipei)—to deliver rich experiences even within limited timeframes. This reflects a strategy tailored to time-constrained travelers, emphasizing efficiency and thematic focus.
Tokyo and Shanghai, by contrast, offer diversified, multi-layered product portfolios. Tokyo’s structure is notable for its high proportion of “Cultural Experiences” (21.0%), particularly those related to subcultures such as anime and cosplay. These offerings showcase Japan’s modern cultural identity and serve as differentiated assets in the global market. Shanghai, meanwhile, emphasizes “Intercity Tours” (11.1%) and “Transportation Services”, highlighting its practical connectivity and regional integration. With offerings such as water town excursions and multi-city packages, Shanghai blends traditional culture with urban accessibility, presenting a composite tourism experience.
Overall, Japanese cities (Tokyo, Osaka) tend to favor compact, city-centered content emphasizing logistical efficiency. Korean (Seoul, Busan) and Chinese cities (Beijing, Shanghai) focus on extending the experience outward, using surrounding regions to enhance thematic depth. Taiwanese cities (Taipei, Kaohsiung), in turn, differentiate themselves through emotionally resonant, nature-based itineraries built around places like Jiufen and Yangmingshan. These patterns reflect each city’s unique geographic, cultural, and infrastructural assets, as well as their respective strategic priorities in tourism development.

While product volume and pricing structures offer insights into the external characteristics of urban tourism markets, the true measure of competitiveness lies in how tourists evaluate their experiences. In this context, average ratings and their variability serve as intrinsic indicators of tourist satisfaction and the internal consistency of urban tourism offerings. These metrics reflect not only whether the products met expectations but also whether cities successfully delivered unique, memorable experiences aligned with their cultural identity.
TripAdvisor-based analysis of rating distributions across Northeast Asian cities offers critical insights into both satisfaction levels and what may be termed the consistency of city branding. Some cities, despite having relatively few products, recorded high average ratings with low variability—suggesting strong quality control and coherent storytelling. Others, with more extensive product portfolios, showed more mixed consumer responses.

Busan exemplifies the former case. Although it had only 233 registered tourism products, it achieved an average rating of 4.9 with the lowest standard deviation (0.25) among all cities. This indicates not only high satisfaction but also remarkable consistency. Key offerings—such as Gamcheon Culture Village, Jagalchi Market, and Gukje Market—blend natural scenery, urban landscape, and everyday life, delivering an authentic experience of "Busan-ness." These products go beyond simple sightseeing to offer deep, identity-driven encounters, which may explain the city’s outstanding performance despite its limited supply.
Beijing, with 2,270 products and a large volume of reviews, similarly achieved both a high average rating (4.91) and low variability (0.33). Its offerings—anchored by iconic heritage assets such as the Great Wall, the Forbidden City, and the Summer Palace—demonstrate the power of symbolic narratives in securing consistent consumer approval. These heritage experiences deliver a strong cultural storyline that resonates with international visitors, enhancing both satisfaction and memory value.
Shanghai also recorded a high average rating (4.89), with slightly more variability (0.39) compared to Beijing, but still within a stable range. The city’s offerings—from water town tours to landmark visits along The Bund—achieve a balance between historical and contemporary appeal. The consistency of high ratings across diverse product types suggests that Shanghai’s multi-dimensional tourism structure successfully communicates a coherent sense of place.
Although each city employs different resources and strategies, Busan, Beijing, and Shanghai share a common trait: they effectively convey their urban identity through high-quality, emotionally resonant tourism experiences. Their high ratings and low standard deviations support the conclusion that cultural coherence, rather than mere product volume, is the cornerstone of satisfaction and competitiveness.
This underscores the role of urban character—not just as a backdrop to tourism, but as a central narrative embedded in the product itself. In this context, "city-ness" refers to the total experiential value derived from a city’s unique history, geography, and cultural storytelling. The ability to consistently deliver this value is what distinguishes successful tourism strategies in today’s global market.
“Outskirts Tours” represent a tourism product category that embodies the hub-and-spoke strategy—connecting the central city (hub) with surrounding destinations (spokes). While “Outskirts Tours” consistently account for a large share of tourism offerings in major cities, the degree of consumer response varies significantly depending on the destination.
Among the cities analyzed, Seoul demonstrates the clearest application of this model. According to TripAdvisor data, Seoul’s “Outskirts Tour” products recorded an average of 194.9 reviews per product, marking the highest level of consumer response among all city-theme combinations. This figure is nearly four times higher than that of Tokyo’s (50.8 reviews), highlighting the exceptional appeal and feedback activity that Seoul’s peripheral content has generated among international visitors.


Two of Seoul’s flagship “Outskirts Tour” products—the DMZ Tour and the Nami Island Tour—serve as compelling examples of a successful hub-and-spoke model. The DMZ Tour, combining the political and historical narrative of Korea’s division with guided interpretation, receives approximately 1,000 reviews per product, reflecting its strong resonance with tourists. Meanwhile, the Nami Island Tour distinguishes itself through a calm, emotionally driven experience centered on natural scenery. Despite requiring travel beyond the city center, both products have elicited high levels of consumer engagement—suggesting that tourists prioritize uniqueness and narrative quality over mere convenience. This insight underscores the principle that the success of “Outskirts Tours” lies in offering attractive content, regardless of distance.

While Tokyo offers many “Outskirts Tours” products to destinations such as Mount Fuji and Hakone, its average review count and consumer response fall short of Seoul’s DMZ offerings. This discrepancy emphasizes the importance not only of symbolic destinations, but also of the narrative frameworks and experience design that captivate international audiences.
In conclusion, Seoul’s “Outskirts Tours” exemplify a highly effective hub-and-spoke strategy with strong consumer responsiveness and market traction. They offer a strategic template that may inform similar initiatives in other cities. However, high interest alone does not guarantee long-term loyalty or satisfaction. Sustained success in “Outskirts Tours” depends on meticulous experience design and consistent quality management—factors that convert attraction into trust.
An analysis of TripAdvisor data reveals that high-value tourism products in Northeast Asia tend to outperform budget offerings in terms of consumer satisfaction, demonstrating a clear competitive edge. By segmenting the dataset into “premium” (top 30% of prices) and “budget” (bottom 30%) product groups, the study found that, with the exception of Kaohsiung, all cities showed higher average ratings for premium products than for budget ones. This suggests that differentiated experiences and high-quality service are key drivers of consumer satisfaction in the premium tourism market.

A more detailed analysis of the top 5% price tier (USD 900 and above) shows a clear pattern: premium tours that include intercity travel tend to achieve both high prices and high satisfaction. In Beijing, “Intercity Tours” recorded an average price of USD 2,148 and an average rating of 4.93, driven by highly rated multi-destination packages including Xi’an and Shanghai. Shanghai showed a similar trend, with an average of USD 959 and a rating of 4.76 for comparable intercity offerings.
Tokyo’s premium experiential tours, including helicopter rides over Mount Fuji (categorized under “Outskirts Tours”), stood out with an average price of USD 1,384 and a rating of 4.81. Notably, the Mount Fuji helicopter tour, priced at USD 3,519, achieved a perfect 5-star rating, demonstrating the potential of high-end experiential products.

This study conducted a quantitative analysis of tourism product composition and consumer response across eight major Northeast Asian cities—Seoul, Busan, Tokyo, Osaka, Beijing, Shanghai, Taipei, and Kaohsiung—using data from TripAdvisor. By applying BERTopic-based topic modeling to classify tourism themes and analyzing consumer response indicators such as price, rating, and number of reviews, the study identified the key factors that underpin tourism competitiveness. The results suggest that rather than the sheer number of offerings or price levels, the critical driver of success is the ability to deliver a coherent and compelling sense of “city-ness” through well-designed tourism content. In particular, the hub-and-spoke strategy for outskirts tours and high-value premium products emerged as core contributors to consumer satisfaction.
Seoul stood out for its strong consumer response to “Outskirts Tours” centered on the DMZ and Nami Island, as well as premium culinary tours, achieving the highest number of reviews per product among all cities. Busan, despite having a smaller product portfolio, recorded an impressive average rating of 4.9, driven by identity-based content such as Gamcheon Culture Village. Tokyo maintained a balanced portfolio combining traditional culture and subculture themes, while Beijing demonstrated competitive strength in high-value products such as Great Wall tours and multi-city itineraries including Xi’an. Shanghai focused on water town excursions and intercity tours, whereas Taipei differentiated itself through emotionally resonant destinations like Jiufen. In contrast, Kaohsiung faced clear limitations due to a very small number of available products. The analysis indicates that cities should move beyond a simple listing of tourism assets and instead focus on creating memorable experiences grounded in local narratives and emotional resonance.
This study emphasizes the need for Northeast Asian cities to reconfigure their tourism strategies toward enhancing experiential density and emotional connection, rather than merely expanding destination lists. In particular, data-driven optimization of product offerings and the proactive use of digital platforms like TripAdvisor will accelerate the digital transformation of the tourism sector. Moreover, content that integrates local narratives and sustainability will be key to building long-term competitiveness.
Going forward, cities must develop mechanisms to continuously analyze consumer feedback in real time through platforms such as TripAdvisor, and leverage this data to reinterpret local assets and design distinctive, memorable experiences. Such efforts will enable Northeast Asian cities to stand out in an increasingly competitive global tourism landscape.
--
To reference this article, please use the following citation: “Deachul (David) Seo, Suckwon Hong, Yejin Ahn (2025). What Makes a City Memorable? A TripAdvisor-Based Analysis of Tourism Products in Northeast Asia, Yanolja Research Insights, Vol. 27.”
--
Footnotes:
* Interquartile Range (IQR): A statistical measure that indicates the spread of the middle 50% of the data. It is calculated by subtracting the first quartile (25th percentile) from the third quartile (75th percentile).
** While both “Outskirts Tours” and “Intercity Tours” involve travel beyond the city center, “Intercity Tours” typically include longer-distance travel, overnight stays, and multi-day itineraries. As a result, they tend to fall into higher price brackets and reflect more complex logistical arrangements.