
Vol.45 The 2026 Yanolja Attractiveness Index
- Reg Date
- 2026.07.29


The 2026 Yanolja Attractiveness Index:
Evaluating Global Tourism City Attractiveness from the Consumer's Perspective
Soocheong Jang, Professor at Purdue University & Director at Yanolja Research / [email protected]
Kyuwan Choi, Professor at Kyung Hee University & Director at H&T Analytics Center / [email protected]
In July 2025, Yanolja Research, in collaboration with Purdue University’s CHRIBA Institute and Kyung Hee University’s H&T Analytics Center, introduced the Global Tourism City Attractiveness Index, hereafter referred to as the Yanolja Attractiveness Index. One year has since passed. If the inaugural study represented an initial attempt to establish the viability of a new evaluative framework, the 2026 study constitutes a second and more consequential observation: it expands the number of cities examined from 191 to 261 and begins the longitudinal task of tracing how the global tourism landscape changes over time.
The need for such an inquiry remains urgent—indeed, it has become even more so. In the post-pandemic era, global tourism has moved beyond recovery and entered a period of structural realignment in which a new competitive order is taking shape. Despite disruptions in some regions arising from the war between the United States and Iran, most national borders have reopened, and international air networks have largely returned to normal operations. Cities around the world are consequently competing more intensely than ever for travelers’ attention, consideration, and eventual choice.
Yet the conventional measures long used to judge success in this competition no longer adequately explain the actual competitiveness of contemporary tourism cities. Authoritative frameworks such as the World Economic Forum’s Travel & Tourism Development Index have traditionally evaluated tourism competitiveness primarily through the conditions and capabilities of the supply side: transportation infrastructure, government policy, tourism resources, institutional quality, and the broader enabling environment. These indicators remain indispensable for assessing whether a destination possesses the capacity and structural foundations required to receive visitors. What they do not directly capture, however, is how travelers themselves perceive, experience, and evaluate the destination. Judging a restaurant solely by the number of its seats or the sophistication of its kitchen would be similarly incomplete. A large, technologically advanced kitchen may indicate considerable production capacity. It tells us little, however, about whether the food delights its guests, whether the experience generates affection, or whether customers leave with a desire to return. Infrastructure may make an experience possible, but it does not determine how that experience is felt.
The same principle applies to tourism cities. A city with a major international airport and an extensive hotel inventory is not necessarily a city that travelers admire or love. A successful tourism city is more than a place that receives large numbers of visitors. It is a place that comes naturally to mind when people imagine their next journey, inspires positive emotions during the visit, and remains in memory long after the journey has ended—a city to which travelers would willingly return.
The Yanolja Attractiveness Index begins with this simple but fundamental insight. It seeks to answer a question that is frequently invoked but rarely measured directly: Which cities do travelers know, and which cities do they love? The point of departure is therefore not what a destination owns or supplies, but what travelers actually recognize, discuss, experience, and feel. Measuring cities through the perceptions and emotional responses of tourism consumers, rather than exclusively through the assets and capacities of tourism suppliers, is both the conceptual foundation and the central purpose of this research.
Developed from this perspective, the Global Tourism City Attractiveness Index shifts the evaluative lens away from the cold materiality of concrete, facilities, and physical infrastructure and toward the living center of tourism: the traveler. It offers a consumer-centered framework grounded in travelers’ actual perceptions, experiences, and emotional responses. The index does not merely count visitors or compare the volume of tourism resources that cities possess. Instead, it evaluates two complementary dimensions. The first is Awareness, which reflects the extent to which a city is recognized, discussed, and made visible within global digital discourse. The second is Attractiveness, which captures the degree to which those who have experienced the city express positive emotions, favorable evaluations, and affective attachment toward it.
These dimensions represent different but mutually reinforcing forms of tourism value. Awareness concerns the breadth of a city’s presence in the traveler’s mind; attractiveness concerns the depth of the favorable response the city evokes. A destination must first enter the field of consideration before it can be chosen. Yet visibility alone is insufficient. A city that is widely known but poorly experienced may attract attention without earning affection. Conversely, a city that generates extraordinary satisfaction among its visitors may remain competitively constrained if it is largely absent from global awareness.
To measure these dimensions, the study draws on large-scale, multilingual social data. Travelers’ voluntarily expressed interests, perceptions, experiences, and emotional reactions are captured through digital discourse and transformed into systematic indicators. Rather than relying solely on surveys, official statistics, or expert assessments, the index listens to the vast and continuously unfolding conversation through which tourism cities are imagined, encountered, evaluated, and remembered. This approach does not suggest that social data offer a perfect or exhaustive representation of the tourist experience. No single source of evidence can do so. It does, however, provide access to a form of tourism intelligence that traditional supply-side indicators have often left unexamined: the spontaneously expressed voice of the consumer. When analyzed across cities, languages, and time, these expressions make it possible to quantify the symbolic visibility and experiential appeal of tourism destinations in a multidimensional and scientifically structured manner.
This report presents the expanded and refined 2026 Yanolja Attractiveness Index. It explains why the evaluation of tourism cities requires a consumer-centered perspective, how the concept of “city attractiveness” can be defined within an academic framework, and how such an inherently perceptual and emotional construct can be measured through systematic data and analytical methods. The report also considers the practical implications of the findings. For national governments, local authorities, destination management organizations, and private tourism enterprises, the index offers more than a ranking. It provides a diagnostic framework for understanding where a city stands in the global tourism imagination and why. It can reveal whether a destination’s principal challenge lies in insufficient visibility, a weak visitor experience, or a disconnect between recognition and emotional appeal. Such distinctions are critical to the design of city-branding strategies, tourism policies, product development, and destination marketing. A city with high attractiveness but limited awareness may need to amplify its story and extend its reach. A highly visible city with comparatively weak attractiveness may need to look inward, addressing the quality, accessibility, authenticity, or emotional resonance of the visitor experience. Cities that perform strongly on both dimensions possess not merely tourism capacity, but a more durable form of competitive advantage: they are both present in the global imagination and valued in the memories of those who encounter them.
The Yanolja Attractiveness Index is ultimately an attempt to reinterpret the tourism value of cities through two elements formed in the traveler’s mind: the breadth of recognition and the depth of affection. It recognizes that tourism competitiveness is not produced by infrastructure alone, nor can it be fully understood through arrival numbers, hotel capacity, or institutional readiness. It is also shaped by attention, emotion, meaning, and memory.
This is therefore not intended as a one-time verdict on the world’s tourism cities. It is the second chapter in a longer empirical journey. Through annual and cumulative observations, the index seeks to trace how cities rise or recede in global awareness, how visitors’ emotional responses evolve, and how shifts in policy, branding, social conditions, and tourism experiences reshape the relationship between destinations and the people who encounter them. Tourism cities do not compete only for arrivals. They compete for a place in the human imagination—and, ultimately, for a place in human memory.
The Scholarly Foundations and Conceptual Framework
Two Forces That Move the Tourist’s Mind and Heart
To translate the invisible power of a city—its attractiveness—into an objective and measurable form, we must first understand why people travel, how they select one city from among countless alternatives, and how they evaluate that city after their visit. The attractiveness of a tourism city is not simply the aggregate of the resources it possesses. Rather, it is the perceptual and emotional outcome produced when tourists’ inner needs encounter the external qualities of a destination.
To explain these psychological and behavioral mechanisms, this study draws on two foundational perspectives in tourism scholarship: Tourism Motivation Theory and Destination Image Theory. Tourism Motivation Theory addresses the questions, “Why do people travel, and where do they choose to go?” Destination Image Theory, by contrast, explains how tourists come to understand and feel about a city—how it is represented in both the mind and the heart.
1. Tourism Motivation Theory: Why Do People Leave, and Where Do They Go?
The first question in understanding the attractiveness of a tourism city is deceptively simple: Why do people leave the familiarity of everyday life to travel, and why do they choose one destination rather than another? The Push–Pull framework developed by Dann (1977) and Crompton (1979) remains one of the most influential theoretical approaches to this question. According to this perspective, tourism behavior emerges from the interaction between Push factors, which generate the desire to travel from within the individual, and Pull factors, which draw the traveler toward a particular destination.
- Push Factors: The Inner Force That Makes People Travel
Push factors refer to the intrinsic and psychological needs that motivate individuals to leave their everyday environment and undertake a journey. Common examples include the desire to escape routine, rest and recover, pursue novelty, achieve personal growth, learn, strengthen social relationships, or seek self-realization. The wish to step away from repetitive work and daily stress, the desire to broaden one’s perspective through exposure to another culture, and the hope of creating meaningful memories with family or friends all represent Push motivations. These motivations emerge before a specific destination has necessarily been chosen. They are the force that propels the individual toward travel itself. In this sense, Push factors answer the question: “Why do I want to travel?”
- Pull Factors: The External Appeal That Leads to a Particular City
Deciding to travel does not automatically determine where one will go. Travelers must still choose among a vast array of destinations, generally selecting the place they believe will best satisfy their needs. At this stage, a destination’s natural landscapes, cultural heritage, cuisine, shopping, festivals, experiential offerings, accessibility, hospitality, and other attributes operate as Pull factors. The snow-covered peaks of Jungfrau, the artistic legacy of the Louvre, the culinary life of Osaka’s backstreets, the spectacle of Broadway, and the restorative environment of Bali all represent destination qualities that pull tourists toward a particular place. Pull factors therefore answer a second question: “Given that I want to travel, where should I go?”
- Tourism Attractiveness Emerges Where Push and Pull Meet
The attractiveness of a tourism city cannot be explained solely by the tourist’s internal needs or by the destination’s resources. A city may possess extraordinary assets, yet fail to appear attractive if those assets do not connect with the traveler’s motivations. Conversely, even a strong desire to travel may not lead to an actual visit if no destination appears capable of satisfying that desire.
Tourism-city attractiveness should therefore be understood as a subjective value created through the alignment of tourists’ internal Push motivations with the destination’s external Pull attributes. For a traveler seeking rest and recovery, scenic landscapes and tranquil accommodations may constitute the strongest forms of attraction. For another traveler seeking novelty, stimulation, and excitement, festivals, performances, nightlife, cuisine, and shopping may be far more compelling. The true attractiveness of a city, then, is determined less by how many tourism resources it possesses than by how effectively those resources satisfy tourists’ needs and are transformed into meaningful experiences.
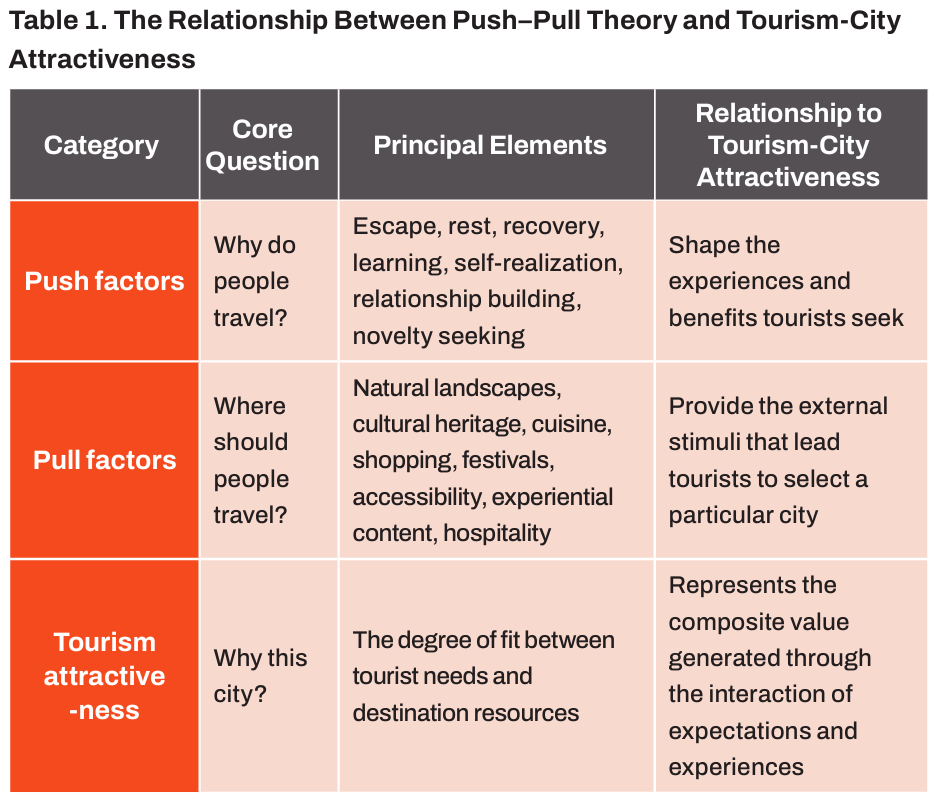
This is also why the present study examines tourism-city attractiveness through multiple dimensions, including natural landscapes, cultural heritage, experiential content, and hospitality. Natural landscapes and cultural heritage are among the most visible Pull resources a city possesses. Experiential content and hospitality, however, determine whether those resources are successfully translated into lived tourism experiences. Tourists do not merely observe a destination’s resources from a distance. They rest within them, immerse themselves in them, learn from them, enjoy them, and form relationships through them. Tourism attractiveness is therefore completed not by the mere presence of resources, but through the interaction of resources, experiences, and tourist motivations.
2. Destination Image Theory: The City Formed in the Tourist’s Mind and Heart
Whereas Tourism Motivation Theory explains why people travel and how they choose destinations, Destination Image Theory explains how a particular city is constructed and evaluated within the tourist’s consciousness. Destination image refers to the totality of the knowledge, impressions, beliefs, and feelings that an individual holds about a place. Even before visiting a city, tourists develop an image of it through news coverage, advertising, film, social media, and the stories of others. After a visit, direct experience may reinforce, reshape, or conflict with this pre-existing image, prompting the tourist to reassess the city. Destination-image research commonly distinguishes between two interrelated components: Cognitive Image and Affective Image.
- Cognitive Image: What Do Tourists Know About the City?
Cognitive image refers to fact-based knowledge and judgments regarding the attributes and functions of a destination. It includes evaluations of the city’s natural environment, cultural heritage, transportation system, accommodations, safety, landmarks, and tourism offerings. When people hear the word “New York” and think of the Statue of Liberty, Times Square, Central Park, Broadway, or the city’s skyline, they are drawing upon elements of cognitive image. Such knowledge provides the informational basis on which tourists compare destinations and assess whether a visit is feasible or desirable.
- Affective Image: How Does the City Make Tourists Feel?
Affective image refers to the atmosphere, emotions, and affective responses that a city evokes. A destination may be perceived as exciting, romantic, relaxing, sophisticated, welcoming, crowded, stressful, or uncomfortable. To think of New York as dynamic, stylish, and exhilarating, or of Paris as romantic and artistic, is to move beyond factual knowledge into emotional evaluation. Cognitive image is formed through what the tourist knows and thinks; affective image is formed through what the tourist feels. In more intuitive terms, the cognitive image belongs to the tourist’s mind, whereas the affective image belongs to the tourist’s heart.
- Cognition and Emotion Operate as a Cycle, Not as Separate Systems
Tourists first perceive and evaluate the attributes of a city, and those evaluations give rise to emotional responses. Yet emotions also influence the way destination attributes are subsequently interpreted. A spectacular nighttime landscape, for example, may produce the cognitive judgment that a city is visually impressive, which may then contribute to an affective image of excitement and vitality. Conversely, experiences of congestion, inconvenience, or discourtesy may weaken even a previously favorable image of the destination. Cognitive and affective images influence consequential tourism behaviors, including visit intention, satisfaction, recommendation, revisit intention, and attachment. A meaningful evaluation of tourism-city competitiveness must therefore consider not only what a city possesses, but also how widely the city is known and how people feel about it.
From Theory to Measurement: Awareness and Attractiveness
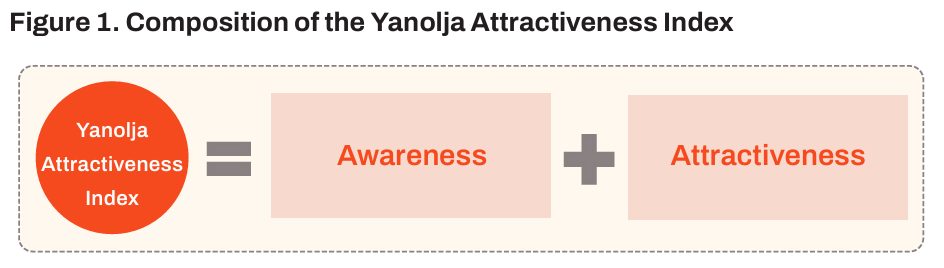
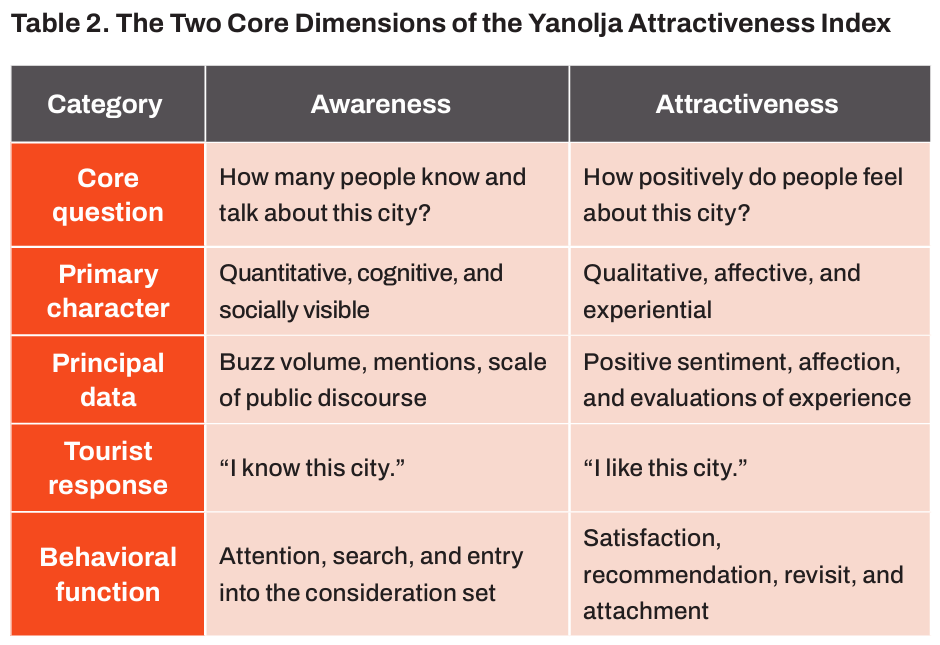
To operationalize Tourism Motivation Theory and Destination Image Theory within a city-evaluation framework, the Yanolja Attractiveness Index conceptualizes the power of a tourism city through two principal dimensions: Awareness and Attractiveness. Awareness, however, should not be regarded as fully synonymous with cognitive image. Cognitive image concerns knowledge and evaluation of a city’s attributes. Awareness is conceptually prior to that process: it indicates whether, and how distinctly, a city exists in tourists’ memory and in public discourse. Awareness is therefore a precondition for the formation of destination image and for inclusion in the tourist’s consideration set. Attractiveness, by contrast, represents the positive emotions and evaluations that emerge in relation to the city.
- Awareness: The Power to Enter the Tourist’s Field of Vision
Awareness indicates how widely a city is recognized, how frequently it is discussed, and how prominently it appears in global tourism discourse. In this study, awareness is measured quantitatively through the volume of city-related buzz and mentions across social media and online channels.
Tourists are unlikely to choose a city they do not know or cannot readily recall. Awareness is therefore the basic condition that allows a city to enter the tourist’s evoked set—the limited group of destinations actively considered when deciding where to travel. Awareness does not necessarily cause people to like a city. It creates the opportunity for the city to be liked. A destination may offer an exceptional experience, but if its existence is barely known, it will struggle to be chosen. Awareness may thus be defined as the power that places a city within the traveler’s mental field of choice: the power to become known.
- Attractiveness: The Power to Move the Tourist’s Heart
Attractiveness refers to the positive emotions and perceived experiential value associated with a city. It is a qualitative indicator grounded in the affection, pleasure, excitement, inspiration, and satisfaction expressed by tourists after encountering the destination directly or indirectly through media and online content. Statements such as “the food was extraordinary,” “the city felt romantic,” or “the people were exceptionally welcoming” do more than describe physical attributes. They reveal the value and emotion experienced by the tourist. Attractiveness does not merely encourage a first visit. It helps a city remain in memory, become part of personal storytelling, and generate a desire to return. It may therefore be understood as the power that allows a city to endure in the tourist’s positive memory and emotional life: the power to become loved.
Beyond Two Dimensions: Toward an Integrated Interpretation
The theoretical architecture of the Yanolja Attractiveness Index assumes a continuous process involving tourists’ internal needs, the external resources provided by destinations, the formation of information and cognition, and subsequent tourist behavior. Within this process, tourism resources such as natural landscapes and cultural heritage do not constitute attractiveness in and of themselves. They become attractive only when tourists perceive them, experience them, and endow them with emotional meaning. Even a beautiful beach may fail to generate a positive experience if it is inaccessible, overcrowded, or embedded in an unwelcoming environment. Conversely, a small and relatively unknown attraction may acquire substantial appeal when it is connected to a distinctive local story, an authentic experience, and genuine hospitality. Tourism-city attractiveness may therefore be understood as the outcome of four interconnected stages:
Resources: What does the city possess?
Experience: How do tourists engage with those resources?
Cognition: How well do tourists know and recall the city?
Emotion: What do tourists feel about the city?
Traditional tourism indicators have largely focused on the first stage: destination resources and supply capacity. The Yanolja Attractiveness Index instead captures the third and fourth stages—the cognition and emotions of tourists—through large-scale social big data. To be chosen, a tourism city must first be known. Yet being known is not enough. The destination must also deliver experiences that meet or exceed expectations and leave behind positive emotions and memories. If awareness brings the city into the tourist’s consideration set, attractiveness helps convert that initial choice into satisfaction, recommendation, revisit, and enduring attachment. The two dimensions are therefore not competing forces. They are mutually reinforcing.
Awareness opens the door to visitation; attractiveness makes people want to open that door again. This is why the Yanolja Attractiveness Index measures both. One dimension reveals the presence a city occupies in the tourist’s mind. The other reveals the value of the experience that remains in the tourist’s heart. Only when the two are examined together can we determine whether a city is widely known but experientially underwhelming, deeply appreciated but insufficiently recognized, or increasingly positioned as a world-class destination with both visibility and emotional appeal. Ultimately, the competitiveness of a tourism city cannot be reduced to its capacity to attract large numbers of visitors. Its deeper strength lies in its ability to sustain a virtuous cycle in which the city is discovered, considered, selected, loved, and spoken of again. The Yanolja Attractiveness Index is a consumer-centered system for evaluating tourism cities by measuring the two forces that sustain this cycle: Awareness, the power to become known, and Attractiveness, the power to become loved.
Distinguishing Tourism Attractiveness from Similar Concepts
Tourism Competitiveness, Destination Brand Image, and the Yanolja Attractiveness Index
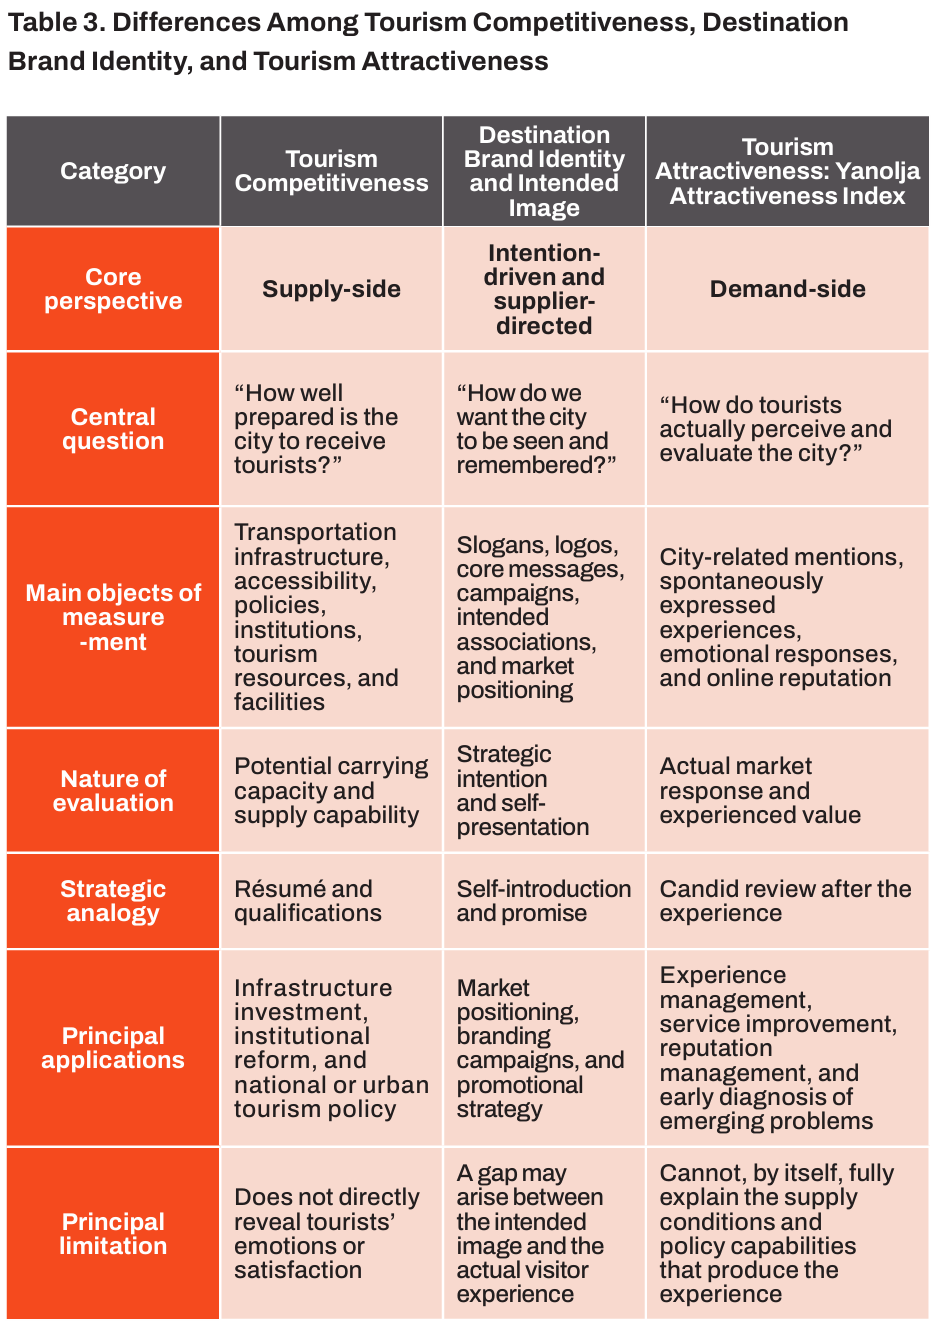
To understand what distinguishes the Yanolja Attractiveness Index, it is necessary to compare it with two related concepts: tourism competitiveness and tourism destination brand image. All three seek to evaluate tourism cities, but they begin from different perspectives and address fundamentally different questions.
Tourism competitiveness evaluates the infrastructure, resources, policies, institutions, and organizational capabilities that enable a city to attract and accommodate visitors. Its central question is: “How well prepared is the city to receive tourists?” It is therefore primarily a supply-side concept. Airports and transportation networks, accommodation capacity, tourism resources, safety, policy environments, and institutional effectiveness are among its principal objects of evaluation. Tourism competitiveness indicators are especially useful for guiding infrastructure investment and formulating medium- and long-term tourism policy.
Tourism destination brand image, by contrast, concerns the identity and desired image that a city seeks to communicate to the tourism market. Its central question is: “How do we want this city to be perceived and remembered?” Through slogans, logos, core messages, storytelling, and promotional campaigns, destination authorities attempt to create a distinctive image and establish a desirable position in the marketplace. Strictly speaking, the supply-side intention underlying this process is more precisely described as destination brand identity or intended brand image. These concepts refer not simply to how a city is perceived, but to how destination organizations wish it to be perceived.
The Yanolja Attractiveness Index begins elsewhere. It asks: “How do tourists actually perceive and evaluate this city?” Rather than measuring the conditions a city claims to possess or the image it seeks to project, the index examines tourists’ spontaneously expressed attention, experiences, emotions, and evaluations in online environments. It is therefore grounded firmly in the demand side of the tourism market. The distinction can be expressed through a simple analogy. Tourism competitiveness is the city’s résumé, presenting its qualifications and capabilities. Destination branding is the city’s self-introduction, articulating how it wishes to be understood and what it promises to deliver. Tourism attractiveness is the candid review written after the experience—an account of what visitors actually encountered, felt, and remembered.
The Complementary Relationship Among the Three Indicators
The three indicators do not substitute for one another. Rather, they are complementary diagnostic tools that represent different stages through which the performance of a tourism city is created.
Tourism competitiveness demonstrates the foundations and capabilities that a city possesses. A destination brand represents the strategic promise that the city communicates to tourists. Tourism attractiveness shows how those capabilities and promises are manifested as actual market responses within tourists’ experiences and emotions.
Tourism competitiveness asks: “What does the city possess?”
A destination brand asks: “What does the city promise?”
Tourism attractiveness asks: “How did tourists actually experience that promise?”
When all three indicators are consistently high, it suggests that the city’s resources and policies, brand messages, and actual tourism experiences are effectively connected.
In contrast, when tourism competitiveness and brand image are strong but attractiveness is low, this may indicate that excellent resources and facilities have not been successfully transformed into positive experiences, or that a gap exists between the brand’s promise and the realities of the tourism setting. For example, a city may have adequate transportation and accommodation facilities and may have conducted large-scale promotional campaigns. However, if tourists experience congestion, discourteous service, high prices, or standardized tourism content, strong supply capabilities and promotional performance will not necessarily translate into high attractiveness.
Conversely, even when tourism competitiveness or awareness is relatively low, a city that receives highly positive evaluations from visitors may be a hidden gem with distinctive content and strong hospitality. The distinctive value of the Yanolja Attractiveness Index does not lie in presenting yet another ranking of cities. Its central contribution lies in identifying gaps that are difficult to detect through existing indicators alone. More specifically, it quantitatively captures the following differences: The gap between the resources a city possesses and the value tourists actually experience, the gap between the brand promise communicated by a city and the reality experienced by tourists, and the gap between how widely known a city is and how deeply it is loved.
These gaps serve as strategic warning signals, revealing where a city’s tourism policies are failing to function as intended. When supply capability is high but attractiveness is low, the city should improve tourists’ experiences of mobility, service, pricing, congestion, and hospitality before making further investments in facilities. When the gap between brand image and attractiveness is large, the city should reconsider whether its brand promise corresponds with the actual experience rather than simply expanding its promotional activities.
Therefore, analyzing tourism competitiveness, destination brand image, and tourism attractiveness together makes it possible to diagnose more precisely where a city’s resources fail to be converted into actual experiences and where the brand’s promise diverges from reality. The most important strategic value that the Yanolja Attractiveness Index adds to existing indicators is its ability to identify the gaps among supply capability, brand promise, and tourist experience, and to suggest directions for improvement.
Core Dimensions of Tourism Attractiveness
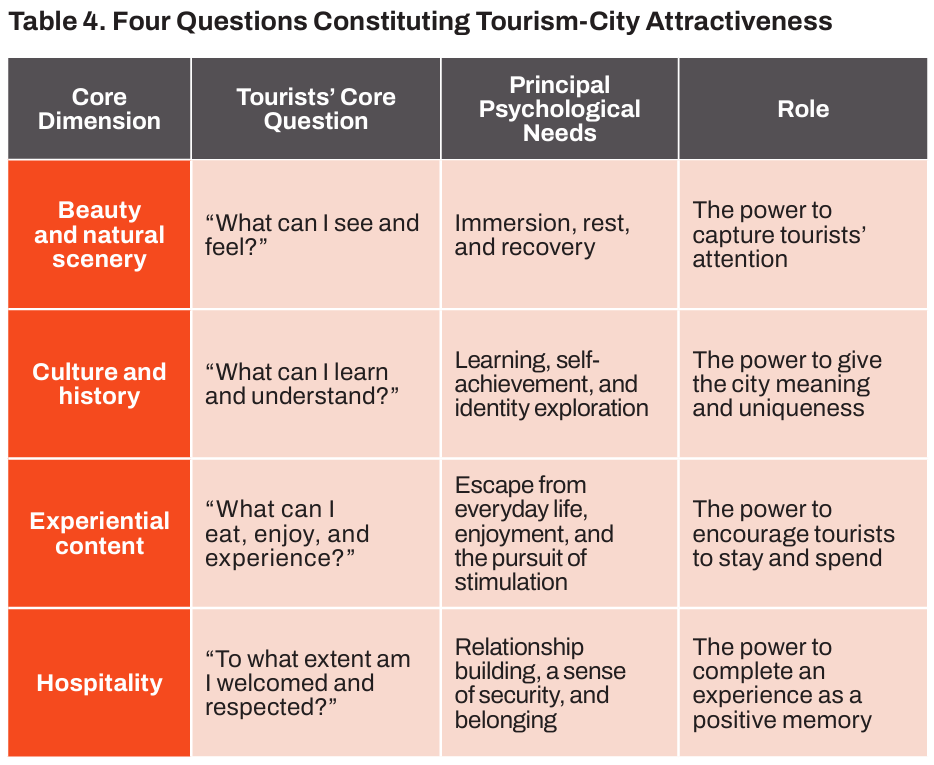
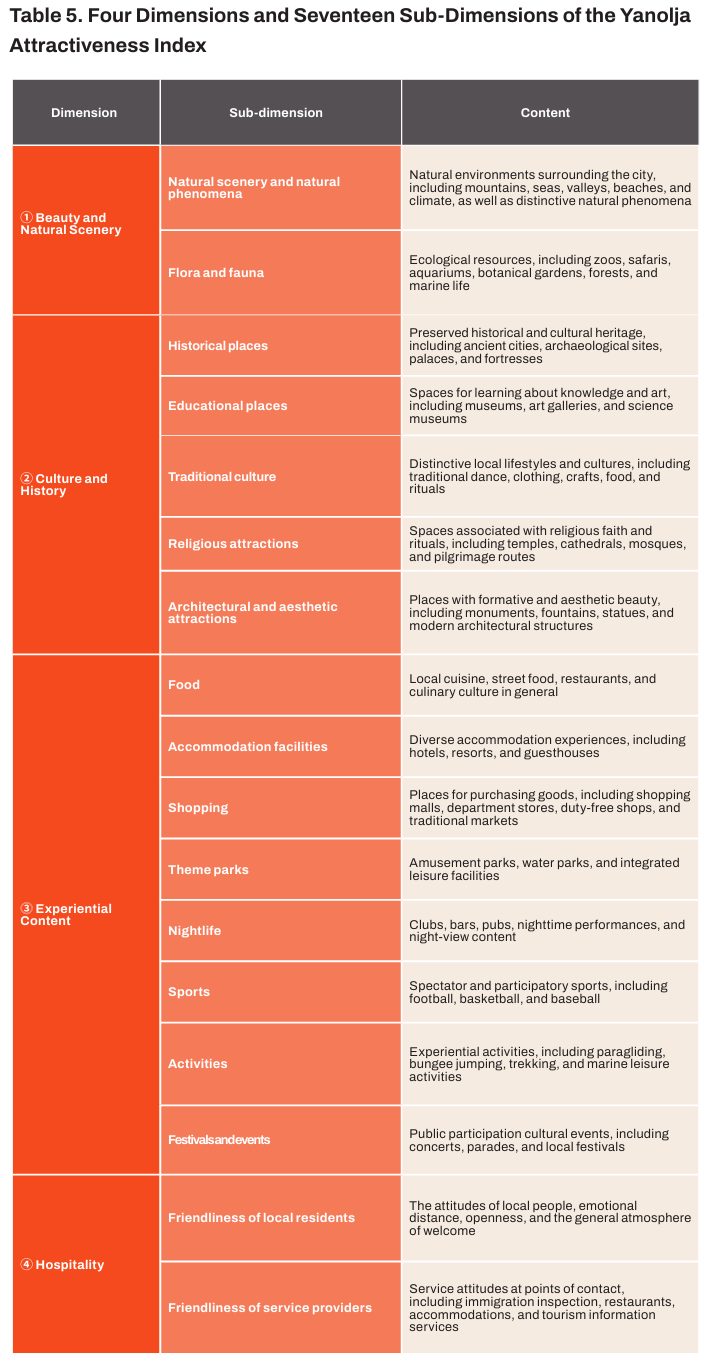
“Attractiveness” is an abstract concept that cannot be directly observed. To measure it objectively, it must therefore be broken down into specific elements that reflect what tourists see, learn, and enjoy in a city, as well as how they are treated. Based on an extensive review of previous studies and consultations with tourism experts, Yanolja Research has structured tourism-city attractiveness into four core dimensions and seventeen sub-dimensions. This framework does not evaluate only the quantity of resources possessed by a city. It also captures how tourists’ internal needs are fulfilled through the city’s resources and content, and how this process leads to particular emotions and evaluations. In other words, the framework dissects a city’s attractiveness through four questions:. What do tourists see? What do they learn? What do they experience? And how are they welcomed?
To compare these dimensions to a single tourism journey, beauty and natural scenery capture the traveler’s attention; culture and history give meaning to the city; experiential content creates reasons to stay and spend; and hospitality completes the memories and emotions associated with the journey as a whole.
1. Beauty and Natural Scenery
Beauty and natural scenery refer to the natural attractiveness offered by a city and its surrounding areas, including mountains, seas, rivers, valleys, beaches, climate, and ecological environments. Nature is one of the most fundamental tourism resources, allowing tourists to escape from everyday life and experience psychological rest and emotional recovery. Powerful natural landscapes, such as Waikiki Beach in Hawaii or the aurora in Norway, can by themselves become strong Pull factors that lead tourists to select a destination. Flora and fauna resources, including zoos, safaris, aquariums, and botanical gardens, also provide tourists with distinctive opportunities to interact with nature and ecosystems. This dimension is closely connected to tourists’ needs for immersion and recovery.
- Natural scenery and natural phenomena: Natural environments and distinctive natural phenomena, including mountains, seas, valleys, beaches, waterfalls, snowy landscapes, sunsets, and auroras
- Flora and fauna: Ecological tourism resources, including zoos, safaris, aquariums, botanical gardens, forests, and marine life
2. Culture and History
Culture and history reveal the distinctive identity and stories that a city has accumulated over time. Tourists do not merely observe historical sites and cultural heritage. Through them, tourists acquire new knowledge and develop an understanding of the lives and values of local communities. The Colosseum in Rome, Gyeongbokgung Palace in Seoul, and the Parthenon in Athens are historical places that connect the past with the present. The Louvre and the British Museum are educational spaces in which visitors experience art and knowledge. Kyoto’s tea ceremony, Spanish flamenco, and traditional Thai massage allow tourists to experience distinctive local lifestyles and cultures firsthand. Culture and history provide a city with a uniqueness that cannot easily be imitated by other destinations. For this reason, they form a central foundation of the city’s brand. This dimension is connected to tourists’ needs for learning, self-achievement, and identity exploration.
- Historical places: Preserved historical and cultural heritage, including ancient cities, archaeological sites, palaces, and fortresses
- Educational places: Spaces for learning about knowledge and art, including museums, art galleries, and science museums
- Traditional culture: Distinctive local ways of life, including traditional dance, clothing, crafts, food, and rituals
- Religious attractions: Places shaped by religious faith and rituals, including temples, cathedrals, mosques, and pilgrimage routes
- Architectural and aesthetic attractions: Places with formative and aesthetic beauty, including monuments, fountains, statues, and modern architectural structures
3. Experiential Contents
Modern tourism is shifting from travel centered on simply “seeing” famous places to travel centered on directly “experiencing” local food, culture, and leisure activities. Accordingly, the attractiveness of a city is determined not only by what it possesses, but also by what tourists can eat, enjoy, and participate in while they are there. Food, accommodations, shopping, theme parks, nightlife, sports, activities, and festivals are core forms of content that increase tourists’ length of stay and spending. Experiences such as Osaka’s street food, a football match in London, a musical in New York, or the Rio Carnival make the image of a city more vivid and memorable. Food and accommodations, in particular, are no longer merely supporting elements of tourism. They may themselves become the principal purpose of a journey. Experiential content fulfills tourists’ needs for escape from everyday life, enjoyment, and the pursuit of new stimulation.
- Food: Local cuisine, street food, restaurants, and culinary culture in general
- Accommodation facilities: Hotels, resorts, guesthouses, and distinctive lodging experiences
- Shopping: Shopping malls, department stores, duty-free shops, traditional markets, and specialized stores
- Theme parks: Amusement parks, water parks, and integrated leisure facilities
- Nightlife: Clubs, bars, pubs, nighttime performances, and night-view content
- Sports: Sports spectatorship and participation, including football, baseball, and basketball
- Activities: Experiential activities, including paragliding, bungee jumping, trekking, and marine leisure activities
- Festivals and events: Concerts, parades, local festivals, and public participation events
4. Hospitality
If beautiful scenery and rich content provide reasons to visit a city, hospitality allows that city to remain as a positive memory. Hospitality refers to the attitudes of the people tourists encounter at airports, hotels, restaurants, attractions, and on the streets, as well as the general atmosphere of welcome throughout the city. A local resident who kindly gives directions to a lost tourist, a hotel employee who quickly resolves a problem, or a restaurant worker who actively assists a visitor despite a language barrier can change the overall impression of a journey. Conversely, even a single discourteous interaction or discriminatory experience can damage the memory of an otherwise excellent trip. Hospitality directly affects not only tourist satisfaction, but also city image, revisit intention, and recommendation behavior. In this sense, hospitality may be described as the “invisible human software” that transforms a city’s tourism resources into tourists’ positive memories.
- Friendliness of local residents: The attitudes of local people, emotional distance, openness, and the general atmosphere of welcome
- Friendliness of service providers: Responses and attitudes at service encounters, including immigration inspection, accommodation, food and beverage services, and tourism information
The Process Through Which Resources Are Transformed into Attractiveness
These four dimensions do not operate independently of one another. Nature and culture form the tourism resources of a city, experiential content transforms those resources into actual tourism experiences, and hospitality adds emotional meaning to those experiences.
For example, even a city with a beautiful beach may fail to transform that resource fully into high tourism attractiveness if the beach is difficult to access, there is little content to enjoy, and the service is unfriendly. Conversely, even when the scale of a city’s natural resources is limited, the organic combination of local history and food, distinctive experiences, and warm hospitality can leave a strong impression on tourists.
Tourism-city attractiveness is therefore not simply the sum of a city’s resources. It is the value of a holistic experience created through the combination of things to see, represented by nature and culture; things to do, represented by food and activities; and things to feel, represented by hospitality.
The Yanolja Attractiveness Index further divides these four dimensions and seventeen sub-dimensions into specific groups of keywords and analyzes the mentions and emotional responses that tourists voluntarily express online. Through this process, the abstract attractiveness of a city is transformed into a measurable indicator grounded in tourists’ actual experiences.
Methodology: 261 Cities, 14 Languages, and 419 Keywords
The “attractiveness” of a tourism city is neither directly visible nor fixed; it varies according to individual emotions and perceptions. To compare this concept consistently across cities worldwide, this study collected the mentions and emotional responses that tourists voluntarily posted online and analyzed them using AI-based natural language processing technologies.
Because the study observes digital records generated from actual travel experiences rather than responses to a structured survey, the approach may be understood as a form of global digital ethnography. The 2026 study expanded the scope of analysis from the previous year and further refined both the city-selection criteria and the keyword system. The overall research process proceeded in the following sequence: City selection → Multilingual data collection → Keyword refinement → AI-based sentiment analysis → Index construction.
1. Expanding the Number of Cities: From 191 to 261
The 2025 study examined 191 cities. In 2026, the scope was expanded to 261 cities. Three criteria were applied in selecting the cities. First, cities included in at least two of sixteen internationally recognized indices related to tourism competitiveness, urban competitiveness, and city branding were identified as major candidates. In 2026, indices published by Oxford Economics, Kearney, Brand Finance, and Saffron Brand Consultants were added, increasing the number of reference indices from twelve to sixteen. Second, to include major cities that were not sufficiently represented in existing global indices, the study applied the criteria of a national population of at least 30 million and a city population of at least 3 million. Third, emerging tourism cities and locally specialized destinations that were difficult to identify through quantitative criteria alone were additionally reviewed through consultation with experts.
By applying these three filters—global indices, city size, and expert judgment—the study enhanced the representativeness and comprehensiveness of the city-selection process. Five Korean cities—Seoul, Busan, Jeju, Incheon, and Daegu—were included in the global assessment.
2. Cities Included in the Published Results and Tier Classification
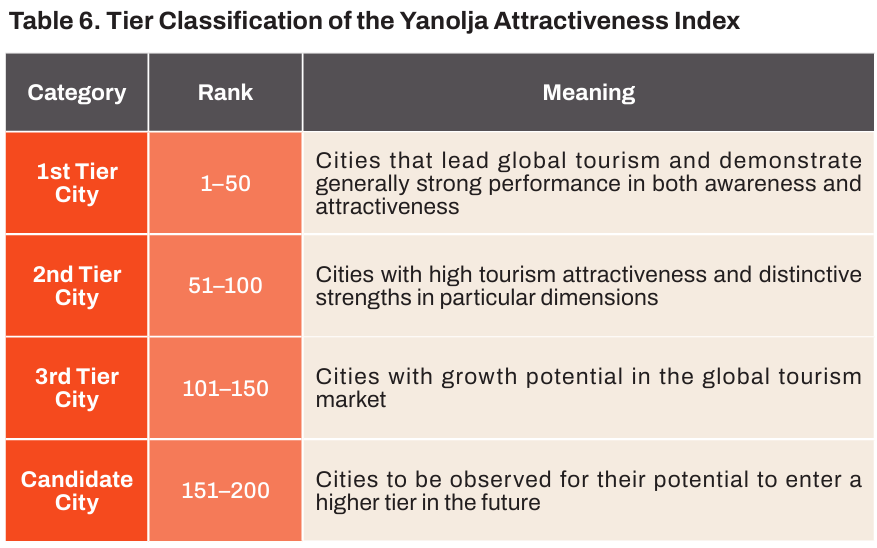
Of the 261 cities examined, the top 200 were selected for inclusion in the published results. As shown in Table 6, these cities were classified into four tiers according to their overall rankings: 1st Tier City, 2nd Tier City, 3rd Tier City, and Candidate City. The detailed rankings of Candidate Cities are not disclosed. This category does not necessarily represent poorly performing cities. Rather, it consists of cities whose future growth potential warrants continued observation.
3. Fourteen Languages and Data-Collection Channels
To reflect the linguistic and cultural diversity of the global tourism market, the study selected fourteen languages in which tourism-related discussion is active in social data: English, Spanish, Arabic, French, Portuguese, Russian, Indonesian, German, Japanese, Turkish, Vietnamese, Korean, Italian, and Thai. Chinese was excluded from the analysis. Major social media platforms in China are subject to restrictions on data access and cross-border data transfer, making it difficult to obtain data with the same level of stability and representativeness as data in the other languages. The inclusion of incomplete Chinese-language data could instead undermine the validity of comparisons between Chinese cities and cities elsewhere. The languages included in the study were not merely instruments of translation. People from different linguistic communities may focus on different attributes and express different emotions even when discussing the same place. Multilingual analysis is therefore a central component of the research design for incorporating the diverse perspectives of global tourists.
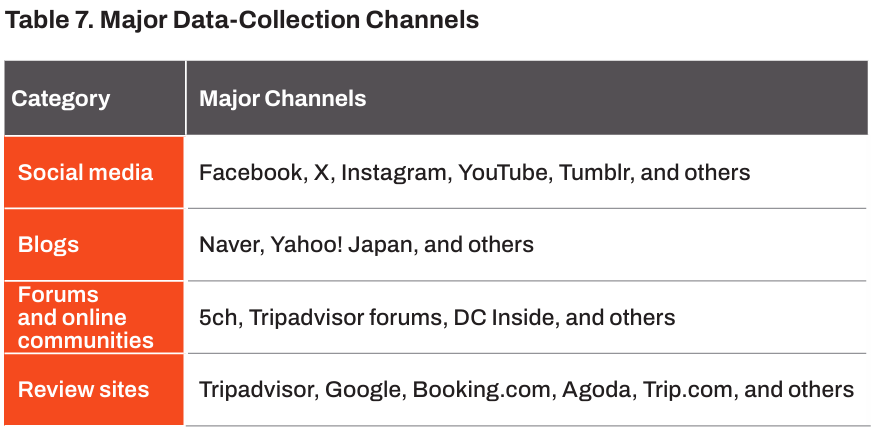
The data consisted of online mentions generated during the most recent one-year period, from June 2025 to May 2026. As shown in Table 7, the collection channels were divided into four broad categories. News and broadcast data were intentionally excluded. Such content often reflects political and economic events or promotional materials issued by tourism organizations rather than tourists’ actual experiences, and may therefore distort the intrinsic attractiveness of a tourism city. The purpose of this study was to capture not official announcements, but the spontaneous reviews and evaluations that tourists leave after their journeys.
4. Brandwatch and AI-Based Sentiment Analysis
This study used Brandwatch, a global social-data analytics platform. Brandwatch is a system capable of collecting and analyzing data across countries, languages, social media platforms, and other online channels in an integrated manner. The context and sentiment of the collected posts were analyzed using an AI model based on the Transformer architecture. Unlike dictionary-based analysis, which simply checks whether a particular positive or negative word is present, this model considers multiple linguistic elements in combination. For example, the English expression “not bad” contains the apparently negative words “not” and “bad,” but its actual meaning is generally positive. Similarly, the Korean expression “yagyeongi michyeotda”—literally, “the night view is crazy”—could be misclassified as negative when interpreted solely according to dictionary definitions. In a tourism review, however, it often conveys strong admiration. Context-based AI analysis considers such expressions and classifies each mention as positive, neutral, or negative. Among these categories, the present study focused on positive and negative responses in analyzing the affective evaluations associated with each city.
5. Building a Library of 419 Keywords
In social big-data analysis, the accuracy of search terms is as important as the volume of data. When inappropriate keywords are used, even a very large dataset may contain results unrelated to tourism attractiveness. This is the familiar problem of “garbage in, garbage out”: flawed inputs lead to flawed outputs.
To prevent this problem, a keyword library for measuring the seventeen sub-dimensions was developed and validated through the following four stages:
- Initial keywords were developed based on previous research and expert consultation.
- Pilot tests were conducted in five cities, and additional related terms were incorporated.
- Noise keywords unrelated to tourism were removed during the main analysis.
- The validity and discriminating power of the keywords were reviewed, resulting in a final set of 419 keywords.
For example, the keyword “weather” appeared relevant to tourism but was excluded because it collected large volumes of weather-forecast data. The keyword “bird” also produced substantial amounts of content from non-tourism contexts, such as “Angry Birds” and “early-bird discounts.” It was therefore either excluded or used in conjunction with separate exclusion terms. This process resembles repeatedly adjusting the size of a fishing net’s mesh so that, rather than merely collecting as much data as possible, the analysis retains only the data relevant to the purpose of the study.
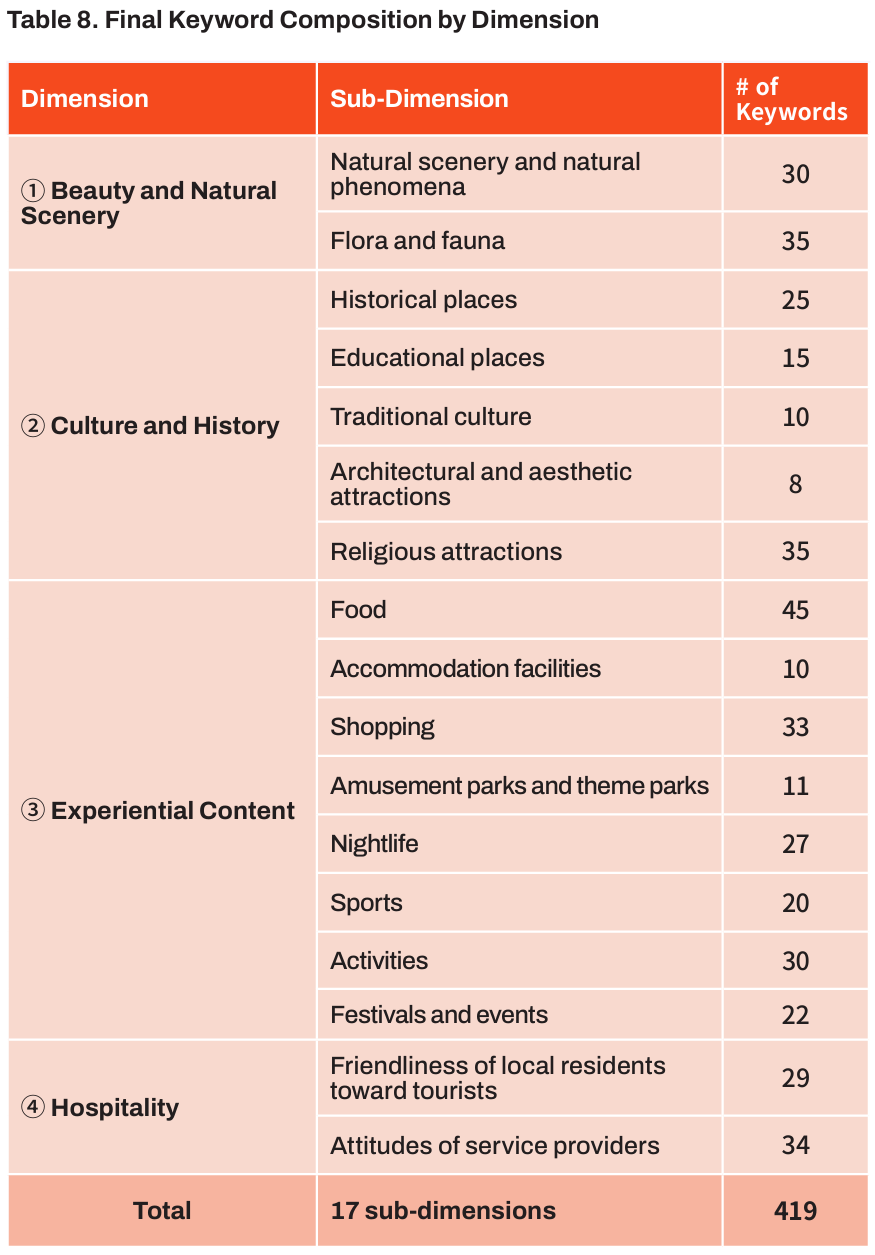
The essence of this research lies not simply in collecting a vast volume of online data. It lies in the step-by-step control of which cities were included, which languages and channels were analyzed, and which keywords were used to capture tourism experiences. The 261 cities represent the scope of the analysis. The 14 languages represent the diversity of tourist voices. The 419 keywords represent the precision of measurement. Through this process, tourists’ voluntary digital records were transformed into city-level measures of awareness and attractiveness.
Index Construction Methodology
The Yanolja Attractiveness Index measures both how frequently a city is mentioned as a tourism destination and how positively it is evaluated. To accomplish this, an Awareness Index and an Attractiveness Index are calculated independently for each city. The two indices are then assigned equal weights of 50% to produce the final Yanolja Attractiveness Index.
The reason for distinguishing awareness from attractiveness is clear. A city that is frequently mentioned is not necessarily evaluated positively. Conversely, even when visitors evaluate a city very highly, its influence as a global tourism city may remain limited if it is barely known. The Yanolja Attractiveness Index therefore evaluates how well a city balances the power to become known with the power to become loved.
1. Two Core Engines: Calculating Awareness and Attractiveness
- Awareness Index: How Widely Is the City Known and Discussed?
The Awareness Index is not calculated simply from the absolute volume of buzz associated with each city. Instead, it is based on the proportion of each city’s buzz relative to the total buzz generated by all cities included in the study. For each sub-dimension (s), the buzz share of city (i) is calculated as follows:
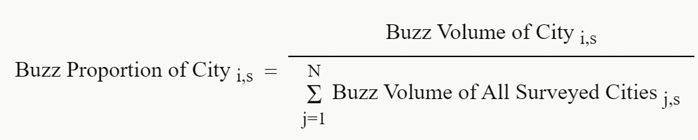
For example, to calculate awareness in the food sub-dimension, the volume of food-related buzz for a particular city is divided by the total volume of food-related buzz generated across all 261 cities. The same calculation is applied to the remaining sub-dimensions, including natural scenery, historical places, and shopping. This distinction is important. Awareness is not an absolute indicator that merely counts how many times a city is mentioned. It is a relative indicator showing the share of global tourism-related conversation occupied by that city.
However, major tourism cities such as New York and Paris may be mentioned thousands of times more frequently than emerging tourism destinations. If this disparity were used without adjustment, a small number of major cities could dominate the results, while many other cities would receive scores close to zero. To reduce these extreme differences, a logarithmic transformation is applied to the buzz shares. The transformed values are then normalized across the cities on a scale ranging from 1 to 10. The Awareness Index is therefore the logarithmically transformed value of a city’s share of total buzz, normalized to a 1–10 scale:

- Attractiveness Index: How Positively Is the City Evaluated?
The Attractiveness Index is based on the proportion of positive evaluations identified through AI-based sentiment analysis. For each city and sub-dimension, the positive evaluation ratio is calculated as follows:

Neutral buzz is excluded from the denominator because it is difficult to determine whether such content reflects a positive or negative evaluative direction.
Calculating attractiveness solely from the positive evaluation ratio, however, may lead to the overvaluation of cities with small samples. Suppose that a city has only three relevant mentions and all three are positive. Its positive evaluation ratio would be 100%. By contrast, a major tourism city with hundreds of thousands of mentions will almost inevitably receive some negative evaluations and is therefore unlikely to achieve a perfect positive ratio. It would nevertheless be unreasonable to conclude that a city with only three positive evaluations is more attractive than a globally established tourism city. To address this problem, the study applies a city-level buzz-volume weight to the positive evaluation ratio. In other words, it incorporates the size of the sample supporting the evaluation.

The buzz-volume weight is a standardized measure of the city’s buzz volume within the relative distribution of all cities included in the study. Applying this weight prevents the high positive ratios of cities with very few mentions from being excessively overvalued.
The resulting weighted attractiveness values are then normalized across cities on a scale from 1 to 10. The Attractiveness Index therefore reflects not merely the positive evaluation ratio, but both the proportion of positive evaluations and the volume of buzz that supports those evaluations:

2. The Three-Step Index Construction Process
Step 1. Calculating Scores for the 17 Sub-Dimensions
Awareness and attractiveness are first calculated independently for each of the 17 sub-dimensions.
- Awareness: City-level share of mentions → logarithmic transformation → normalization to a 1–10 scale
- Attractiveness: Positive evaluation ratio × buzz-volume weight → normalization to a 1–10 scale
For example, separate awareness and attractiveness scores are calculated for each city in every sub-dimension, including food, shopping, natural scenery, historical places, and the friendliness of local residents.
Step 2. Calculating Scores for the Four Higher-Order Dimensions
The 17 sub-dimensions are integrated into the following four higher-order dimensions:
- Beauty and natural scenery
- Culture and history
- Experiential content
- Hospitality
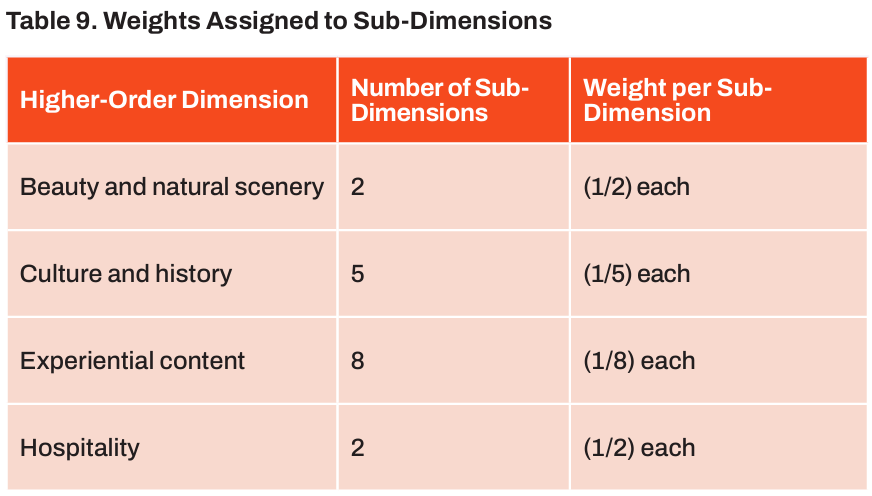
Equal weights are assigned to the sub-dimensions belonging to the same higher-order dimension. For example, the experiential content dimension consists of eight sub-dimensions: food, accommodation, shopping, theme parks, nightlife, sports, activities, and festivals and events. Each is therefore assigned an equal weight of (1/8):

Equal weighting is used to prevent researchers from assigning arbitrarily greater importance to frequently mentioned sub-dimensions such as food or shopping, thereby undervaluing the other sub-dimensions. Awareness and attractiveness remain separate at this stage and are aggregated independently.
Step 3. Calculating Each City’s Overall Awareness and Attractiveness Scores
Differential weights were assigned to the four higher-order dimensions based on expert review. Beauty and natural scenery, culture and history, and experiential content were each assigned a weight of 30%, as they represent the core assets that shape a city’s tourism identity and motivate visitation. Hospitality was assigned a weight of 10%. Hospitality has an important influence on tourist satisfaction and revisit intention. However, it functions relatively more as an operational factor that shapes the quality of on-site service and the tourism experience than as an initial factor that directly motivates destination choice. This distinction was considered when determining its weight.
The decision to assign hospitality a lower weight of 10% does not imply that hospitality is less important. Beauty and natural scenery, culture and history, and experiential content constitute the core assets that define a city’s tourism identity and provide reasons to visit. Hospitality, by contrast, determines the quality and completeness of the service and on-site experience perceived by tourists during the actual visit. Expert review and consultation also indicated that online mentions related to hospitality appeared relatively less frequently than mentions of other tourism elements. This finding was also considered in the weighting process.
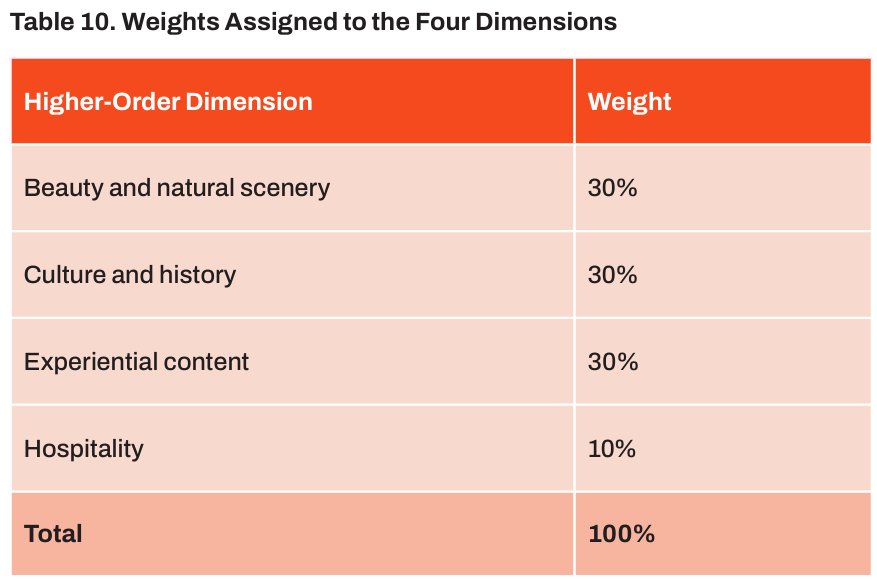
Using the same 30:30:30:10 weighting structure, an overall Awareness Index and an overall Attractiveness Index are calculated independently for each city.
3. The Final Yanolja Attractiveness Index: 50% Awareness and 50% Attractiveness
Finally, the overall Awareness Index and the overall Attractiveness Index are combined with equal weights of 50%. The final score is presented on a scale ranging from 1 to 10:
Yanolja Attractiveness Index = 0.5 * Awareness Index + 0.5 * Attractiveness Index
Awareness and attractiveness are given equal weights because neither can be regarded as inherently more important than the other. A city that is famous but delivers a disappointing experience cannot be regarded as a well-balanced global tourism city. Nor can a city that provides an excellent experience but remains almost entirely unknown. The purpose of the Yanolja Attractiveness Index is therefore not simply to identify cities that are famous or cities with high positive evaluation ratios. It seeks to identify cities that are evaluated as positively as they are well known—and that are as widely known as their positive evaluations warrant.
Three Principles of Index Design
First, the index measures each city’s relative share of total buzz rather than its absolute buzz volume. This makes it possible to identify the city’s substantive share of attention within global tourism discourse.
Second, the index reduces distortions caused by scale and sample size. A logarithmic transformation is applied to awareness so that the extreme buzz volumes of major cities do not dominate the results. A buzz-volume weight is applied to attractiveness to prevent cities from being overvalued on the basis of only a small number of opinions.
Third, the index balances awareness with actual experience. By assigning 50% to awareness and 50% to attractiveness, it evaluates both the city’s global presence and the positive experiences of tourists.
Ultimately, the Yanolja Attractiveness Index is not designed merely to identify the city that is mentioned most frequently or the city with the highest positive evaluation ratio. It identifies cities that receive meaningful attention in global tourism discourse and successfully convert that attention into positive tourism experiences. If awareness is the power that allows a city to enter the tourist’s consideration set, attractiveness is the power that allows it to be remembered and recommended after the visit. The Yanolja Attractiveness Index expresses the balance between these two forces in a single number.
Results: 2026 Global Tourism City Attractiveness Assessment
As explained earlier, the 2026 Yanolja Attractiveness Index classified 261 global cities into four groups according to their overall rankings: 1st Tier Cities ranked 1st–50th, 2nd Tier Cities ranked 51st–100th, 3rd Tier Cities ranked 101st–150th, and Candidate Cities ranked 151st–200th. The rankings of the 1st Tier Cities are provided in the appendix of the report. The full published results are available on the Yanolja Research website:
https://www.yanolja-research.com/brand/attractiveness/ranking/overall?lang=kr
A Reshuffling at the Top: Rise of Asia and Potential of Korean Tourism
The 2026 Yanolja Attractiveness Index indicates that competition among global tourism cities is shifting away from a model driven primarily by awareness toward one that places increasing importance on actual tourism experiences and emotional satisfaction. Traditional Western tourism capitals continue to occupy leading positions on the strength of their high global awareness. At the same time, Asian cities—particularly those in Japan and Korea—are rising through the strength of their experiential content, hospitality, and positive affective evaluations.
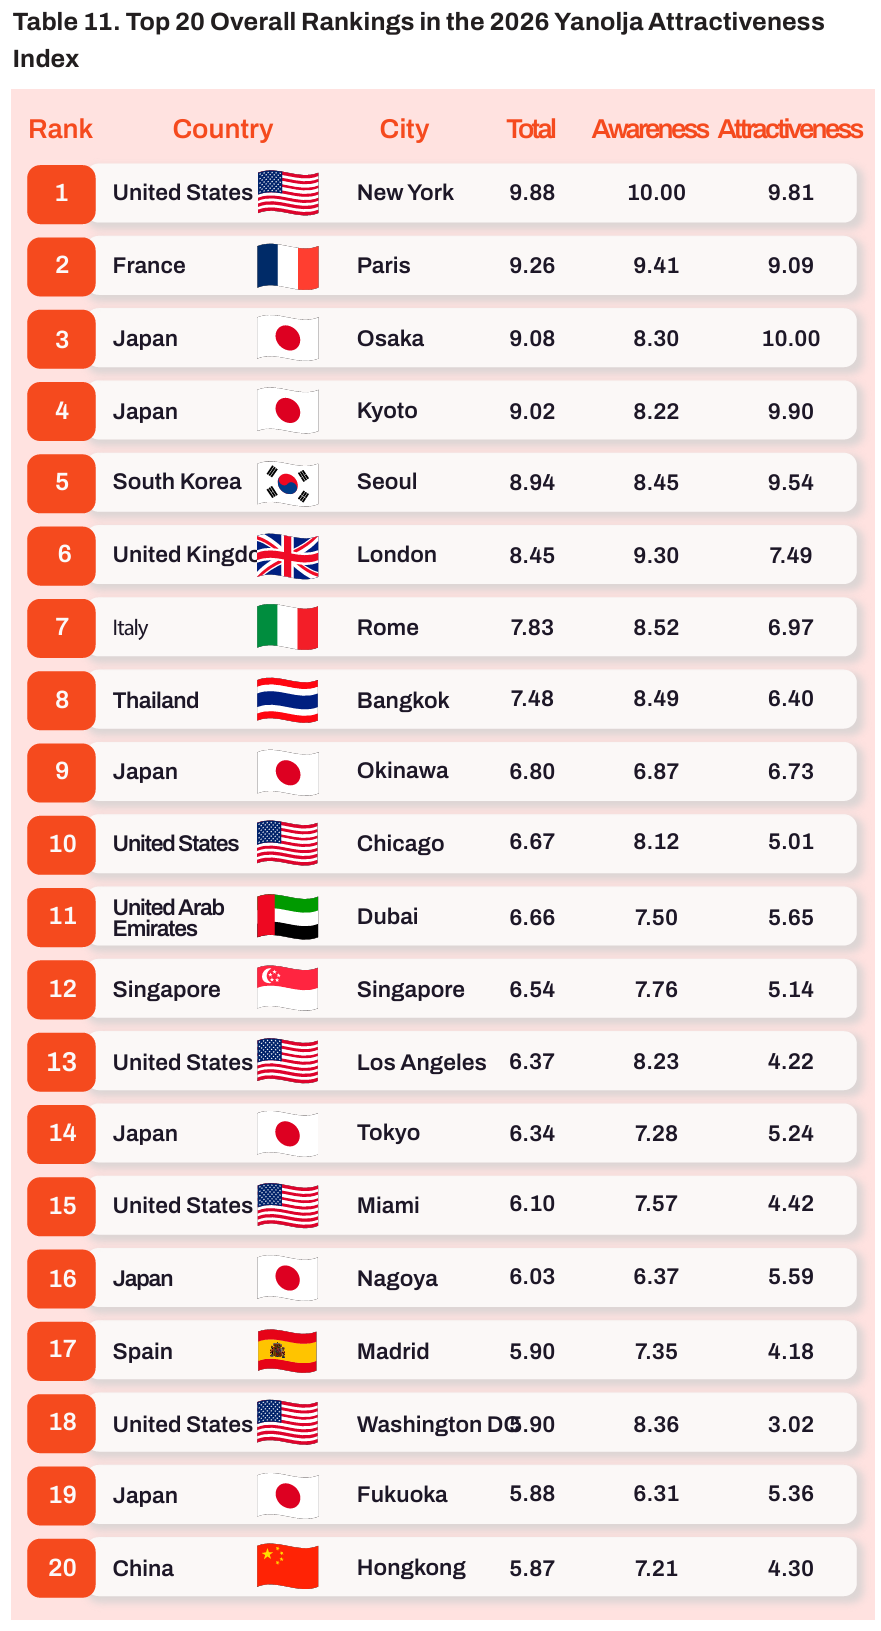
New York ranked first overall in 2026 with a score of 9.88, followed by Paris, Osaka, Kyoto, and Seoul, which together formed the global Top 5. The Top 20 included six Japanese cities and five American cities, meaning that the two countries accounted for 55% of the highest-ranked destinations. Yet the pathways through which they reached the top were markedly different. American cities generally benefited from high awareness, whereas Japanese cities demonstrated particular strength in attractiveness—the positive evaluation of tourists’ actual experiences.
The Global Top 20: Cities Reaching the Summit by Different Routes
- No. 1 New York: The Overall Leader in Both Awareness and Actual Attractiveness
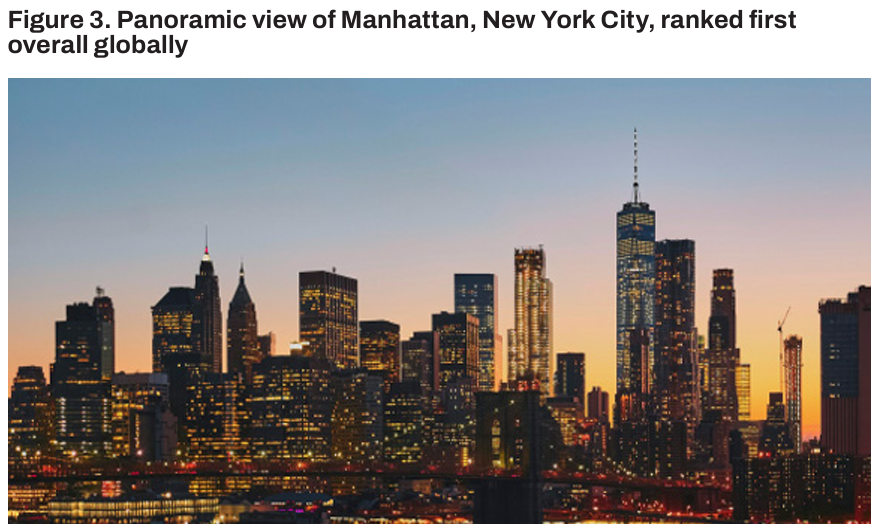
New York ranked first in awareness and third in attractiveness, placing first overall. This result reflects more than the city’s global fame; it was also supported by strongly positive evaluations of actual tourism experiences. New York ranked first in beauty and natural scenery, experiential content, and hospitality, while placing third in culture and history. Its consistently high performance across all four dimensions suggests that the city is no longer perceived merely as a center of business and shopping. Instead, New York is understood as a multidimensional tourism city in which Central Park and the urban landscape, Broadway and professional sports, food and nightlife, and a wide range of service experiences come together to form an integrated visitor experience.
- No. 2 Paris: A Traditional Power Sustained by Culture and History
Paris ranked second in awareness and fifth in attractiveness, retaining second place overall for the second consecutive year. In addition to its high global awareness, Paris ranked first in the world in culture and history, reaffirming its symbolic status and competitiveness as a traditional tourism city. The Eiffel Tower, the Louvre Museum, historic streets, and the Haussmannian architectural landscape continue to shape the city’s image while also serving as core assets of the actual tourism experience. The case of Paris demonstrates that even as tourism becomes increasingly experience-oriented, cultural heritage and urban aesthetics accumulated over centuries remain forms of competitiveness that are difficult to replicate.
- No. 3 Osaka: No. 1 in Attractiveness, Powered by Experiential Content and Hospitality
Osaka ranked eighth in awareness but first in attractiveness, placing third overall. Although its overall ranking declined slightly from the previous year, Osaka remained one of the world’s leading “attractiveness-dominant” cities, maintaining the highest level of positive visitor evaluation. The city ranked second in both experiential content and hospitality. Food, shopping, accommodations, theme parks, and nightlife—elements in which tourists can directly participate and take pleasure—contributed strongly to these positive assessments. Combined with Osaka’s distinctive culture of friendly and energetic service, these attributes have allowed the city as a whole to be perceived as a tourism experience that delivers high levels of satisfaction.
- No. 4 Kyoto: A Distinctive Urban Experience Combining Traditional Culture and Natural Scenery
Kyoto ranked tenth in awareness but second in attractiveness, placing fourth overall. Its high evaluation reflects the organic combination of traditional culture, historical places, natural scenery, and hospitality. Kyoto is not perceived simply as a city containing famous temples and cultural heritage. It is viewed as a destination in which the urban landscape, everyday cultural practices, and service experiences create a consistent and distinctive atmosphere. Together with Osaka, Kyoto illustrates the world-leading quality of the actual tourism experiences offered by Japanese cities.
- No. 5 Seoul: A Well-Balanced Tourism City with Strength Across All Dimensions
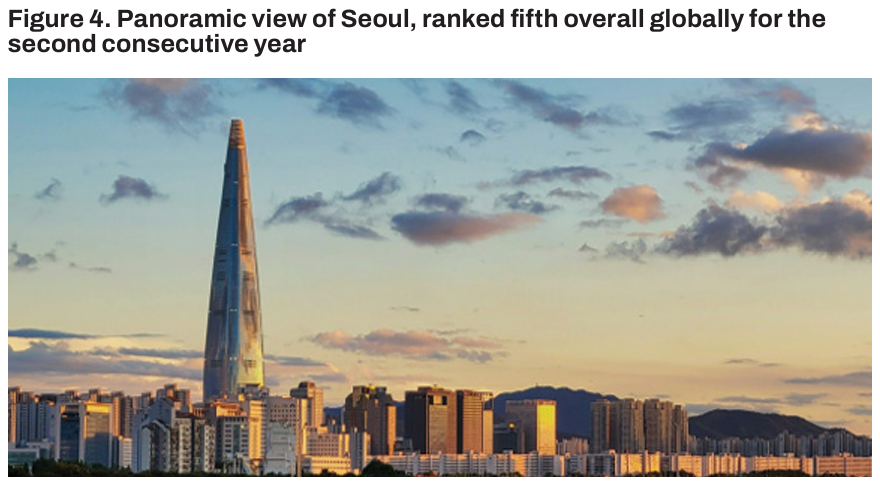
Seoul ranked sixth in awareness and fourth in attractiveness, placing fifth overall. Its greatest strength lies in its balance: Seoul has secured both strong global awareness and positive evaluations of actual tourism experiences. The city ranked third in beauty and natural scenery, experiential content, and hospitality, and seventh in culture and history. The Han River and surrounding mountain landscapes, royal palaces and traditional culture, food, shopping and activities, and convenient urban services work together to provide a comprehensive tourism experience that is not excessively dependent on any single element.
- No. 6–20: Leading Cities with Distinctive Identities
London ranked sixth overall, third in awareness, and sixth in attractiveness. Its long history, architectural and aesthetic attractions, museums, and cultural infrastructure provide a strong foundation for converting global awareness into actual tourism experiences. Rome ranked seventh overall, fourth in awareness, and seventh in attractiveness. It maintained its leading position through its exceptional cultural heritage, including historical places, religious attractions, and architectural symbolism. Rome remains a representative traditional tourism city in which the entire urban environment functions as a vast historical and cultural space. Bangkok ranked eighth overall, fifth in awareness, and ninth in attractiveness. Festivals and events, accommodations, shopping, food, and nightlife—forms of experiential content that tourists can directly consume and enjoy—were key strengths.
Okinawa ranked ninth overall. Although it was only 28th in awareness, it placed eighth in attractiveness, making it a leading example of an attractiveness-dominant city whose actual tourism experience is evaluated much more highly than its level of recognition. Natural scenery, marine activities, and accommodation facilities contributed to strong satisfaction as a resort destination. Chicago ranked tenth overall, 11th in awareness, and 16th in attractiveness. Although its attractiveness was somewhat lower than that of the very highest-ranking cities, it performed relatively evenly across all four dimensions. Urban content such as sports, architecture, food, and nightlife supported its entry into the global Top 10.
Japan’s strong presence extended well beyond Osaka and Kyoto. Okinawa, Tokyo, Nagoya, and Fukuoka were also included in the Top 20. This indicates that the competitiveness of Japanese tourism cities is not concentrated in only one or two flagship destinations. Rather, it is distributed broadly across cities offering different forms of tourism, including traditional culture, urban experiences, and nature-based recreation.
Awareness–Attractiveness Positioning: Two Different Urban Stories
One of the most powerful diagnostic tools of the Yanolja Attractiveness Index is its positioning analysis, which calculates awareness and attractiveness separately and then compares them side by side. This analysis classifies cities into four quadrants:
- High awareness and high attractiveness
- Awareness-dominant, with attractiveness requiring improvement
- Attractiveness-dominant, with a need for greater exposure
- Low awareness and low attractiveness
This framework makes each city’s strategic position immediately visible.
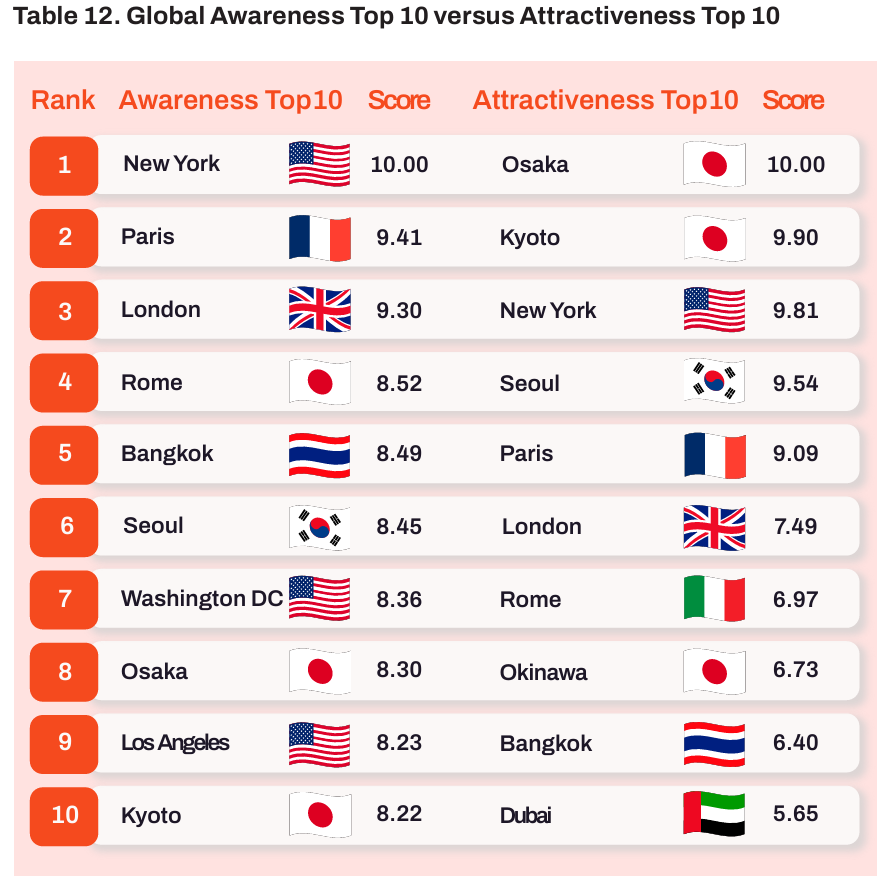
The message of Table 12 is clear. The upper ranks in awareness are dominated by traditional tourism capitals and major American cities, including New York, Paris, London, and Rome. These cities possess brands accumulated over long periods, iconic landmarks, extensive global media exposure, and major international transportation-hub functions. The upper ranks in attractiveness, however, show an overwhelming strength among Japanese cities, including Osaka, Kyoto, Okinawa, Nagoya, and Fukuoka. This contrast clearly demonstrates that high urban awareness does not necessarily lead to positive evaluations of the travel experience. A structural difference emerges: the United States is strong in global city awareness, whereas Japan is comparatively strong in positive evaluations of actual tourism experiences.
This gap is particularly pronounced among American cities. Washington, D.C. ranked seventh in awareness but only 60th in attractiveness, revealing an extreme difference between the two indicators. Los Angeles, Boston, and San Francisco likewise ranked considerably lower in attractiveness than in awareness. These findings provide strong evidence that a city’s level of international recognition or symbolic importance does not necessarily translate into tourism experiences evaluated at the same level. A city may be world-famous as a political and administrative capital or as an economic and cultural hub, yet the emotional reactions expressed by tourists who actually visit may tell an entirely different story.
By contrast, Osaka, Kyoto, and Seoul represent prominent attractiveness-dominant cities whose attractiveness rankings exceeded their awareness rankings. Osaka ranked first in attractiveness compared with eighth in awareness; Kyoto ranked second compared with tenth; and Seoul ranked fourth compared with sixth. Nagoya, Fukuoka, Yokohama, Sapporo, Jeju, Da Nang, and Nha Trang also ranked clearly higher in attractiveness than in awareness. These cities form a group in which evaluations of actual tourism experiences are stronger than the cities’ levels of global exposure. This suggests that attractiveness is determined not simply by how widely a city is known, but by experiential elements that tourists encounter during their visit, including food, shopping, accommodations, natural scenery, and hospitality. Because the awareness of many of these cities remains relatively limited, they possess the potential to rise further in the overall rankings as their global exposure expands.
Analysis by Tier
1st Tier Cities: The Group Leading Global Tourism
The 1st Tier, comprising cities ranked 1st–50th overall, includes global leaders that demonstrated strong performance across all four dimensions. The Top 10 consisted of New York, Paris, Osaka, Kyoto, Seoul, London, Rome, Bangkok, Okinawa, and Chicago. New York, Paris, and Seoul were balanced cities with strong performance in both awareness and attractiveness. Osaka and Kyoto displayed particularly strong attractiveness relative to their awareness. London, Rome, and Bangkok, by contrast, were supported in the overall rankings by their high awareness. Even within the 1st Tier, cities reached the top through different routes.
The United States had the largest number of cities in the 1st Tier, but many of them—apart from New York—tended to record lower attractiveness than awareness. Japan, by contrast, had a diverse group of cities in the 1st Tier, including Osaka, Kyoto, Okinawa, Tokyo, Nagoya, Fukuoka, Yokohama, and Sapporo. This shows that Japanese tourism competitiveness is broadly distributed rather than concentrated in one representative city.
2nd Tier Cities: Upper-Middle-Ranking Cities with Distinctive Strengths
The 2nd Tier, comprising cities ranked 51st–100th, included Incheon, Rio de Janeiro, Brasília, San Diego, Da Nang, Santiago, Manchester, Phuket, Hanoi, and Munich. Although these cities demonstrated lower overall competitiveness than the world’s leading destinations, they possessed clear strengths in particular dimensions or sub-dimensions. Asian cities such as Da Nang, Nha Trang, Taipei, Ho Chi Minh City, and Daegu received relatively robust positive evaluations of their actual tourism experiences. Moscow, Lagos, and Brussels, by contrast, recorded lower attractiveness relative to awareness, indicating a need to improve tourism content and service experiences.
3rd Tier and Candidate Cities: Cities with Growth Potential
The 3rd Tier, comprising cities ranked 101st–150th, included Monaco, Sicily, Ottawa, Cebu, and Bengaluru. This group contained both cities such as Cebu and Kaohsiung, whose attractiveness exceeded their awareness, and cities such as Tehran and Pattaya, whose awareness was relatively stronger. Candidate Cities ranked 151st–200th included major Chinese cities such as Hangzhou, Shenzhen, Xi’an, Suzhou, Wuhan, and Chengdu, as well as emerging destinations such as Phnom Penh and Kathmandu. For these cities, their potential for future change is more important than their current detailed rankings. They are therefore treated as destinations requiring continued observation.
The Competitive Landscape by Continent
The cities in the upper global tiers are concentrated primarily in three regions: North America, Western Europe, and East Asia. Yet each region reaches the upper rankings through a distinctly different competitive structure.
- North America: A Group of Awareness-Dominant Metropolises Led by New York
North America’s 1st Tier presence is led by New York, followed by globally recognized metropolitan cities such as Chicago, Los Angeles, Miami, and Washington, D.C. The United States placed 16 cities in the 1st Tier, the largest number of any country. With the exception of New York, however, many of these cities were awareness-dominant. Washington, D.C., Los Angeles, San Francisco, and Boston maintained their overall positions partly through awareness levels that exceeded their tourism attractiveness. Their reputation and symbolic importance are firmly established, but the experiences and positive evaluations perceived by actual visitors may not be as strong as their recognition would suggest. Apart from São Paulo, major Latin American cities were generally concentrated in the 2nd Tier or below. This indicates that upper-level tourism competitiveness in the Americas is largely centered on major cities in the United States.
- Europe: A Deep Competitive Base, but a Clear Gap After the Top Three Cities
Western Europe includes not only the very highest-ranking cities—Paris, London, and Rome—but also a broad range of upper- and middle-ranking cities distributed from the 1st Tier through the 3rd Tier. Among the 261 cities examined, Europe was found to have the deepest foundation of tourism cities. This reflects the broad accumulation of traditional tourism resources—including historical and cultural heritage, architecture, museums, and religious attractions—across numerous countries and cities. Nevertheless, even European cities in the 1st Tier, such as Madrid, Milan, Barcelona, Berlin, and Venice, displayed substantial gaps in attractiveness compared with Paris, London, and Rome. Manchester, Munich, Florence, Vienna, Lisbon, and Athens were classified as middle-ranking cities that require improvements in attractiveness despite possessing a certain level of awareness. This can be interpreted as a warning that historical reputation alone is insufficient to sustain competitiveness. Cities must continuously improve experiential content and service quality.
- Asia: The Rise of Cities Competing Through Attractiveness
In Asia, leading cities in Japan and Korea occupy the upper ranks of the 1st Tier. From the 2nd Tier downward, the competitive field expands considerably to include tourism cities in Southeast Asia, India, China, and the Middle East. Osaka, Kyoto, and Seoul formed Asia’s highest-ranking group on the strength of their attractiveness. Southeast Asian and Taiwanese cities such as Nha Trang, Da Nang, Ho Chi Minh City, Cebu, and Kaohsiung also recorded relatively high attractiveness within their respective tiers. This means that Asian cities receive particularly positive evaluations for elements experienced during the actual visit, including food, shopping, accommodations, hospitality, urban convenience, and experiential content. Many Indian, Chinese, and Middle Eastern cities were included in the 3rd Tier, suggesting considerable room to strengthen tourism attractiveness relative to their urban scale.
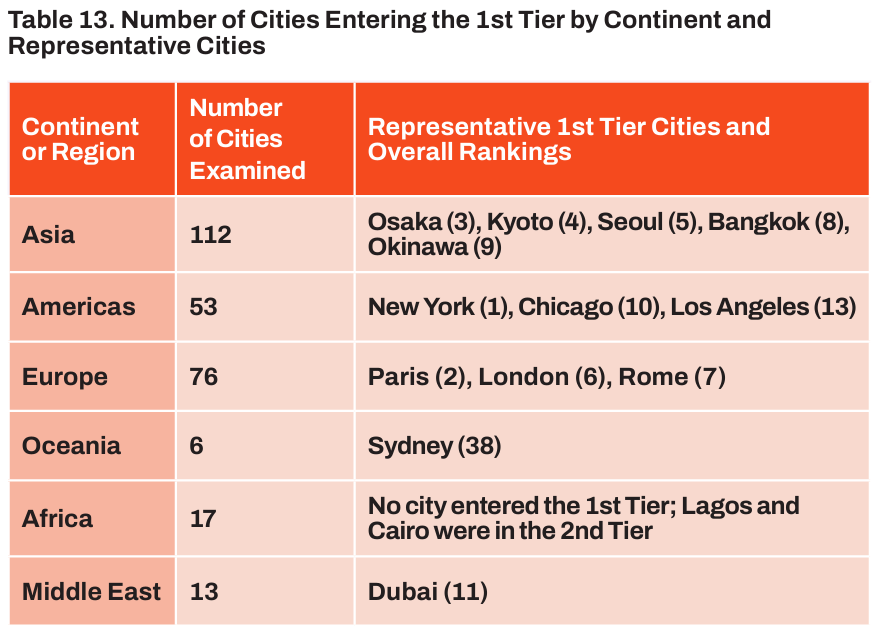
- Oceania and Africa: Limited but Distinct Potential
In Oceania, Sydney was the only city to enter the 1st Tier, ranking 38th. Melbourne and Perth were placed in the 2nd Tier, while Brisbane and Auckland were in the 3rd Tier. The region therefore displays a structure centered on Sydney as its single representative global tourism city. No African city entered the 1st Tier. Lagos and Cairo were included in the 2nd Tier. Overall, African cities recorded relatively low attractiveness compared with awareness, limiting their presence in the global rankings. Cairo and Cape Town, however, displayed comparatively stronger growth potential in attractiveness.
Analysis of the Four Dimensions
The overall ranking shows each city’s total performance. The four dimension-level results reveal what each city competes through. If the overall score is a city’s total grade, the dimension scores are its individual report-card results in natural scenery, culture, experience, and hospitality.
1. Beauty and Natural Scenery
New York ranked first, followed by Kyoto, Seoul, Osaka, Paris, London, and Okinawa. New York’s first-place result demonstrates that natural scenery does not necessarily refer only to untouched natural environments such as mountains and oceans. Experiences that combine nature and the urban landscape—such as Central Park, waterfront spaces, and the skyline—can also leave a strong impression on tourists. What matters, therefore, is not simply how many natural resources a city possesses, but how attractively those natural and scenic resources are perceived and experienced by tourists.
2. Culture and History
Paris ranked first, Kyoto second, New York third, Rome fourth, and London fifth. The upper ranks included not only Kyoto and Rome, which possess strong traditional cultures and ancient heritage, but also New York and London, whose museums, architecture, and cultural infrastructure are highly developed. Osaka and Seoul ranked sixth and seventh, respectively, demonstrating that the historical and cultural assets of East Asian cities are being evaluated as globally competitive. Culture and history are not determined solely by the number of old ruins a city possesses. Their value depends on how naturally they are connected to the contemporary urban experience.
3. Experiential Content
New York ranked first, Osaka second, and Seoul third. New York’s strengths included food, sports, nightlife, and activities. Osaka performed strongly in shopping, accommodations, theme parks, and nightlife. Seoul’s strengths included food, shopping, and activities. These results suggest that tourists attach importance not only to what they see, but also to what they eat, purchase, enjoy, and personally experience. The richer a city is in content that visitors can repeatedly participate in and consume during their stay, the stronger its experiential competitiveness becomes.
4. Hospitality
New York ranked first in hospitality, followed by Osaka, Seoul, Kyoto, and Paris. This result shows that hospitality is not merely an image of being a “friendly city.” It reflects the actual attitudes of residents and service providers whom tourists encounter at airports, hotels, restaurants, and tourism attractions. The strong performance of major tourism cities may be interpreted as the positive result of mature tourism industries and service systems accumulated through the process of serving large numbers of visitors. Taken together, the four dimensions demonstrate that the attractiveness of a tourism city does not derive from a single resource. Strong attractiveness emerges only when the natural, historical, and cultural assets a city already possesses are combined with the food, activities, and services tourists experience on site.
Spotlight on Korean Tourism Cities
Five Korean cities were included in the 2026 global assessment: Seoul, Busan, Jeju, Incheon, and Daegu.
- Seoul: A Balanced Global City with Both Awareness and Attractiveness
Seoul ranked fifth overall, sixth in awareness, and fourth in attractiveness. It ranked third in natural scenery, experiential content, and hospitality, and seventh in culture and history. Seoul therefore entered the global Top 10 in all four dimensions. The Han River and surrounding mountains, royal palaces and traditional culture, food, shopping and activities, and convenient urban services are organically connected, creating a balanced tourism experience that does not depend on a single resource. Seoul may be understood not as a team dependent on one or two star players, but as an all-round tourism city with strength across every position.
- Busan and Jeju: Potential Cities Entering the 1st Tier
Busan ranked 42nd and Jeju 44th, placing both cities in the 1st Tier. Busan demonstrated relative strength in hospitality and marine-city content, while Jeju performed strongly in natural scenery and resort experiences. Based on the presented index values, however, neither city recorded an attractiveness score higher than its awareness score. It is therefore more accurate to interpret them not uniformly as attractiveness-dominant cities, but as cities with strengths in particular dimensions and the potential to improve the quality of their tourism experiences. Busan needs to connect its marine scenery, cuisine, festivals, and hospitality into an integrated stay-oriented experience. Jeju needs to combine its natural assets with activities, wellness, and local culture.
- Incheon and Daegu: 2nd Tier Cities Requiring Growth Strategies
Incheon ranked 51st overall, placing it at the top of the 2nd Tier. It possesses strong accessibility as a gateway city with an international airport, but it requires more content capable of converting that accessibility into actual stays and visitor spending. The central challenge is to transform Incheon from a city tourists pass through into a city in which they choose to stay.
Daegu ranked 88th overall and has room to improve both awareness and attractiveness. The city requires a focused strategy that identifies its most distinctive assets among cuisine, modern cultural heritage, festivals, fashion, and urban content, and then communicates those assets internationally.
Taken together, it would be inconsistent with the current index values to categorize all five Korean cities as destinations whose attractiveness exceeds their awareness. Seoul is a balanced city whose attractiveness ranking is higher than its awareness ranking. Busan, Jeju, Incheon, and Daegu, however, are growth-stage cities that must improve both awareness and attractiveness.
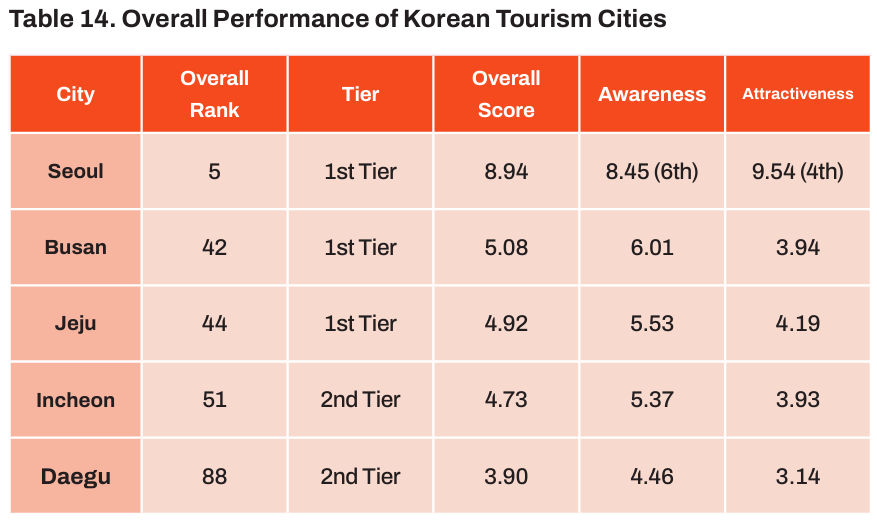
The challenge facing Korean tourism is not simply to increase the volume of exposure. Seoul must communicate its already high-quality tourism experience more widely. Regional cities must strengthen stay-oriented content and service experiences while also expanding their international visibility. As Seoul demonstrates, other Korean cities can also rise into the upper ranks when they connect their distinctive urban assets to actual tourism experiences and communicate those experiences effectively to the global market.
Policy and Industry Implications
The Yanolja Attractiveness Index is not a scorecard that merely lists cities by rank. By examining awareness and attractiveness alongside four core dimensions and seventeen sub-dimensions, it functions as a diagnostic tool that reveals where problems lie and what should be improved first. The central principle is straightforward. Cities with insufficient awareness need greater exposure, while cities with insufficient attractiveness need improvements in the actual visitor experience. When these two problems are not distinguished—and the same promotional campaigns and facility investments are repeatedly applied to every city—tourism budgets may increase without producing a meaningful improvement in tourism competitiveness. Central governments and national tourism organizations, local governments and destination management organizations, and businesses in the tourism and hospitality industries should therefore use the index in ways that correspond to their respective roles.
For Central Governments and National Tourism Organizations
1. Shift the Focus of Tourism Policy from “Attracting Visitors” to “Designing Experiences”
National tourism policies have traditionally been evaluated through quantitative outcomes, including international visitor arrivals, tourism receipts, air routes, and the supply of accommodation facilities. Yet high awareness does not necessarily lead to high attractiveness. Even a world-famous city may fall short of visitors’ expectations in terms of actual experience and emotional evaluation. Tourism policy must therefore move beyond the question, “How many people did we attract?” It must also ask: What did tourists experience, and how positively did they remember and recommend that experience? If visitor volume represents the quantitative outcome of tourism policy, attractiveness represents the qualitative outcome of the experience. The role of a national tourism organization should accordingly expand beyond destination promotion. It should become an integrated experience designer that connects food, culture, nature, activities, and services.
2. Manage the Awareness–Attractiveness Gap as a Core Policy Indicator
The difference between awareness and attractiveness provides an early signal of problems in tourism policy. If awareness rises after a national image campaign but attractiveness does not improve, governments should examine on-site services and tourism content before investing in additional promotion. Conversely, regions whose awareness remains low relative to the quality of their actual experiences may achieve comparatively rapid growth through international media exposure, joint promotions with airlines and online travel agencies, global events, and multilingual content. The awareness–attractiveness gap can therefore serve as a core key performance indicator showing whether the value promised by a national tourism brand is being realized in the actual visitor experience.
3. Begin the Dispersal of Regional Tourism with “Connectivity and Exposure,” Rather Than Facility Expansion
In the case of the Republic of Korea, reducing the concentration of international tourism demand in the Seoul metropolitan area does not require the construction of new tourism facilities in every region. When a city already possesses competitive natural assets, cuisine, festivals, and local culture, it may be more effective to improve accessibility, product connectivity, and global exposure than to invest in additional physical infrastructure. The central government should give priority to the following:
- Multi-city travel products connecting Seoul with regional destinations
- Improvements in mobility linking airports, railways, and local transportation
- Stay-oriented products combining regional cuisine, festivals, nature, and activities
- User-generated content campaigns using international visitors’ reviews and videos
- Joint promotions with overseas airlines, online travel agencies, and media organizations
The essence of regional tourism dispersal is not to force tourists to visit regional destinations. It is to create concrete reasons to visit and to connect tourists to those experiences with as little friction as possible.
4. Develop Market-Specific Strategies Based on Push–Pull Theory
Tourist visitation emerges from the interaction between Push factors—internal needs such as relaxation, escape from everyday life, learning, and self-achievement—and Pull factors, such as the nature, culture, experiences, and hospitality offered by a destination.
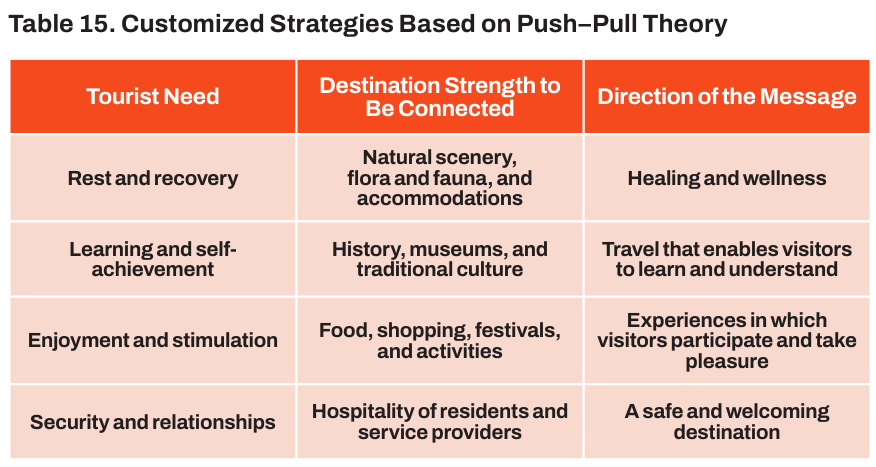
Rather than communicating the same message to every country and market, cities should use data to identify which tourist needs they can satisfy most effectively and select their target markets accordingly.
For Local Governments and Destination Management Organizations
1. Use the Index as a “Map for Resource Allocation”
The central question in local tourism policy should not be, “What else should we build?” It should be, “Where should we invest our limited budget first?” For example, a city that receives high evaluations for culture and history but low evaluations for experiential content should not simply repeat campaigns promoting its cultural heritage. It should instead supplement the overall visitor experience through nighttime tourism, performances, festivals, cuisine, shopping, and participatory programs. Rather than repeatedly investing in areas where strengths are already clear, cities should identify the weak points that diminish the tourism experience as a whole. If the overall ranking is comparable to the general conclusion of a medical examination, the seventeen sub-dimensions resemble detailed test results that reveal the location of the problem.
2. Verify Policy Effectiveness on an Annual Basis
An annual index can serve as a tool for assessing the return on tourism-policy investment. If a city provides hospitality training for tourism employees, it should determine whether its hospitality score improves in the following year. If it expands nighttime tourism programs, it should examine whether indicators related to nightlife, festivals, and events have increased. The policy cycle should therefore proceed as follows: Problem diagnosis → Policy implementation → Tracking of relevant indicators → Impact evaluation → Expansion, modification, or termination. An improved score provides evidence for expanding a policy. If no change occurs, the target of the program and the method of implementation should be reconsidered. Tourism policy should no longer be organized around one-off events. It should operate through a virtuous cycle of diagnosis, implementation, evaluation, and improvement.
3. Benchmark the “Best City by Attribute,” Rather Than Merely a Nearby City
A city’s true competitor is not necessarily a neighboring destination or a city with a similar overall ranking. A city seeking to strengthen culinary tourism should examine cities that receive high evaluations for food. A city seeking to expand nighttime tourism should study destinations with strong nightlife and events. A city seeking to improve hospitality should examine cities whose residents and service providers receive particularly positive evaluations. The purpose is not to reproduce successful cases exactly. Cities should analyze the following questions and reinterpret the findings according to local conditions:
- To which experiences did tourists respond positively?
- How were pricing, language services, transportation, and service delivery designed?
- In what ways did local residents and private businesses participate?
4. Make Strengths Distinctive and Address Weaknesses Strategically
Attempting to strengthen every dimension equally can blur a city’s identity and disperse its budget. Kyoto’s central competitive strengths are traditional culture and natural scenery. Osaka’s are experiential content and hospitality. Seoul’s strength lies in its balance across several dimensions. A city strategy should therefore sharpen its strongest attribute into a representative brand while improving weaknesses to the point that they no longer disrupt the overall visitor experience. The first priority is not to create a city that does everything well. It is to create a city with a compelling and clearly recognizable reason to visit.
For Tourism and Hospitality Industries
1. Restructure Products Around Experience Categories with Growing Market Demand
Increasing interest in educational attractions, activities, and shopping suggests that tourists increasingly prefer travel that enables learning, participation, and self-expression rather than passive observation. Travel agencies, hotels, airlines, and online travel agencies can expand experience-oriented products such as:
- Packages combining accommodations with docent-led museum and art-gallery tours
- Packages combining regional cuisine with shopping at traditional markets
- Trekking, marine leisure, and adventure programs
- Products combining performances and festivals with transportation and accommodations
- Themed travel products integrating K-beauty, K-pop, and fashion
2. Manage Hospitality as an Asset of the Entire Regional Industry, Not Merely of Individual Businesses
Tourists do not necessarily remember an unfriendly experience at a restaurant or hotel as a problem belonging only to that establishment. They often connect it to the image of the city as a whole. Hospitality is therefore not merely part of an individual company’s reputation. It is a shared asset of the regional tourism industry. Regional tourism associations and businesses should jointly develop service training, multilingual assistance, complaint-resolution systems, and quality-certification programs. At the same time, they should improve the working conditions and treatment of tourism employees. Hospitality cannot be produced through slogans or manuals alone. It becomes sustainable when employees can work in stable conditions and possess the authority and capability to resolve problems at the point of service.
3. Differentiate Marketing According to the Awareness–Attractiveness Profile
Required marketing strategies differ according to the combination of awareness and attractiveness.
- Hidden-gem destinations: Actively disseminate the reviews, photographs, and videos of actual visitors.
- Overexposed destinations: Address the causes of low evaluations before increasing advertising.
- Leading destinations: Maintain quality while strengthening repeat visitation and customer loyalty.
- Growth-foundation destinations: Select representative content and concentrate on clearly defined target markets.
For hidden-gem destinations in particular, user-generated content showing why actual tourists enjoyed their visits is more persuasive than a supplier’s claim that “our city is excellent.” Conversely, when a destination has high awareness but low attractiveness, additional advertising may further widen the gap between expectations and reality. In such cases, the destination should rebuild trust by beginning with specific streets, foods, natural spaces, or local experiences that already receive positive evaluations. The most important message of the Yanolja Attractiveness Index is simple: problems of promotion must be distinguished from problems of experience. Adding facilities to a destination that lacks awareness, or expanding advertising for a destination with low attractiveness, is unlikely to produce the desired results. A sustainable tourism city is not simply one that attracts the greatest number of visitors. It is a city that delivers the experience it promises—and transforms the positive memories of that experience into recommendations and repeat visits.
Conclusion: The Cities That Endure in Memory Will Prevail
Competition among global tourism cities is no longer simply a race to attract more visitors. The defining question of the future is which cities come to mind first when people plan a journey, fulfill their expectations during the visit, and remain in their memories as places they wish to return to after the journey has ended. If awareness is the power that places a city within the traveler’s consideration set, attractiveness is the power that converts that initial interest into satisfaction, recommendation, and repeat visitation.
The 2026 Yanolja Attractiveness Index provides concrete evidence of this transformation in the competitive landscape of global tourism cities. New York and Paris did not reach the highest ranks by relying solely on the global reputations they had accumulated over generations. They maintained broadly balanced competitiveness across four dimensions: beauty and natural scenery, culture and history, experiential content, and hospitality.
Osaka, Kyoto, and Seoul, by contrast, have shorter histories as global tourism brands than New York or Paris, yet they have already reached the highest global levels in visitors’ positive evaluations of actual tourism experiences. These results demonstrate that the status of a tourism city is never fixed. Even an internationally renowned city may see the gap between reputation and reality widen if it fails to manage the quality of the actual visitor experience. Conversely, a city that is not yet widely known can grow into a globally competitive destination by offering distinctive content, warm hospitality, and a convenient and satisfying travel environment.
Reputation may provide a starting point in the competition among cities. What ultimately protects that position, however, is the quality of the experience that tourists actually perceive. The Yanolja Attractiveness Index is therefore not a simple scorecard designed merely to arrange cities from first place downward. It is a digital stethoscope and a strategic compass that allow cities to diagnose themselves through the eyes of tourists and determine where limited resources should be invested first. A city with weak hospitality must improve service quality and its systems for responding to visitors on site. A city with insufficient experiential content must expand activities, festivals, nighttime attractions, and other opportunities in which tourists can participate directly. A city whose awareness remains low relative to its attractiveness must communicate the positive reviews and experiences of actual visitors more effectively to the global market.
Such diagnosis and improvement do not constitute a zero-sum contest in which one city’s gain must be another’s loss. When one city improves its service quality and another develops new experiential content, travelers gain a wider range of meaningful choices, and the quality of the global tourism experience rises as a whole. Data-driven competition among cities can therefore create a virtuous cycle. It encourages each city to differentiate itself while simultaneously elevating the quality of the broader global tourism ecosystem.
An important opportunity is also opening for Korean tourism. Seoul has entered the highest global ranks in both overall performance and attractiveness, demonstrating its competitiveness as a leading international tourism city. Busan, Jeju, Incheon, and Daegu have likewise identified their respective potential and strategic challenges within the global market. The sustainable growth of Korean tourism, however, will require more than simply extending Seoul’s success across the country. Each region must develop a different and compelling reason to visit. The task is no longer limited to “making Korea known.” It is now necessary to communicate convincingly to international markets what particular experience each city offers and why that experience is worth traveling for.
This will require an organic combination of the central government’s regional tourism dispersal strategy, the data-driven policies of local governments and destination management organizations, and the differentiated products and services of the tourism and hospitality industries. In particular, if global interest in K-culture is not to remain a temporary fashion, Korea must establish a tourism value chain that converts interest in cultural content into visits to cities, visits into longer stays and greater spending, and those stays into satisfaction and repeat visitation.
Yanolja Research does not intend for this index to remain a one-time study. Just as the scope of the research has expanded from 191 to 261 cities and the number of reference indices has increased from twelve to sixteen, the study will continue to improve not only the breadth of its analysis but also its methodological rigor and practical relevance for tourism policy and industry. Data accumulated annually will do more than show a city’s current position. Over time, it will become a long-term tourism asset that tracks the direction in which awareness and attractiveness are changing and evaluates whether the efforts of governments and industries are being translated into measurable outcomes.
Cities of the future will compete not over how many facilities they possess, but over what emotions and stories those facilities and experiences leave with visitors. The future of tourism will depend not on the display of supply capacity, but on the thoughtful design of experiences and the patient accumulation of trust. Ultimately, a strong tourism city is not simply a city that receives many visitors. It is a city that comes to mind first when a journey is being planned, fulfills expectations while the visitor is there, and becomes more appealing—rather than less—after the traveler has returned home. The future standing of tourism cities will be determined not only by the number of people who visit them, but by how deeply and how long they remain in the hearts and memories of those who have experienced them.
References
Crompton, J. L. (1979). Motivations for pleasure vacation. Annals of Tourism Research, 6(4), 408–424.
Dann, G. M. S. (1977). Anomie, ego-enhancement and tourism. Annals of Tourism Research, 4(4), 184–194.
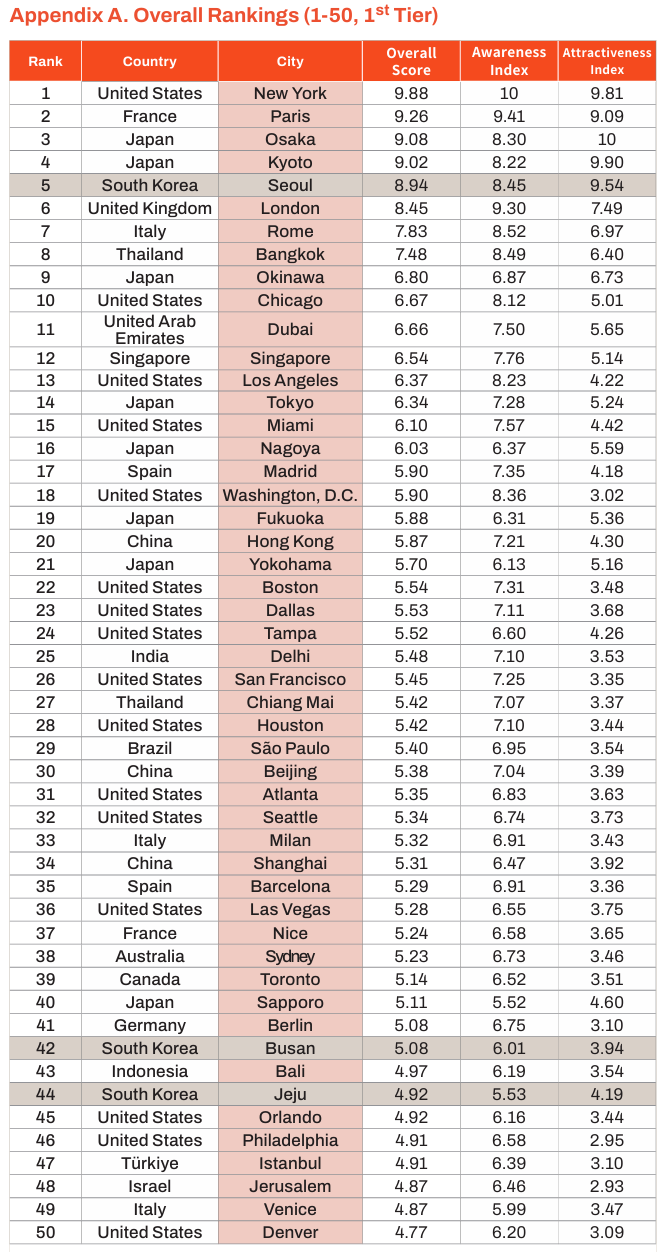
To reference this article, please use the following citation: “Soocheong Jang, Kyuwan Choi(2026). The 2026 Yanolja Attractiveness Index: Evaluating Global Tourism City Attractiveness from the Consumer’s Perspective, Yanolja Research Insights, Vol.45.”
 Prev
Prev  Back
Back 