
SooCheong Jang, Professor at Purdue University & Director at Yanolja Research / [email protected]
Kyuwan Choi, Professor at Kyung Hee University & Director at H&T Analytics Center / [email protected]
South Korea’s tourism policy has reached a critical turning point. For many years, tourism was primarily regarded as an industry centered on leisure and recreation. However, the structural challenges now facing Korean society make it increasingly difficult to view tourism as merely a supplementary industry. Amid rapid demographic change, population decline and aging outside the Seoul metropolitan area, the weakening of regional manufacturing bases, and a structural slowdown in domestic consumption, tourism must be redefined as a strategic industry—one that goes beyond attracting visitors to reinforce local consumption and create a new engine of national growth.
Population decline, in particular, is not simply a matter of having fewer residents. It also means a reduction in the number of economic actors who consume, work, start businesses, pay taxes, and sustain the circulation of local economies. Whereas the annual number of births averaged approximately 1.03 million in the 1960s, the figure has recently fallen to less than one-quarter of that level. At the same time, the core consumer segment—people in their late thirties through their fifties, who typically account for a large share of consumer spending—is gradually shrinking. Meanwhile, those born in the 1960s, once the country’s largest demographic cohort, have already begun entering their sixties and transitioning into retirement. These shifts are placing structural downward pressure on demand across local commercial districts, service industries, accommodation and food services, and the broader culture and leisure sectors.
The challenge is that population decline is not occurring evenly across the country. Young people continue to concentrate in the Seoul metropolitan area in search of education, employment, and cultural infrastructure, while population decline and aging are advancing more rapidly in non-metropolitan regions. The expansion of areas at risk of local extinction is no longer a distant concern; it is already visible in statistical indicators and residential population maps. Under these conditions, local communities can no longer rely solely on the natural growth of their resident populations. While recovering the birth rate and attracting large-scale industries remain long-term priorities, regions also need alternative sources of consumption that can help sustain their economies in the short to medium term. One such source is an externally generated “consuming population.”
Tourism is one of the most important industries for generating this type of consuming population. Tourists may not be registered residents, but they dine at local restaurants, stay in accommodation facilities, use transportation services, and spend money on experiences, performances, exhibitions, shopping, and local content. An increase in tourist arrivals therefore represents more than a rise in visitor numbers; it produces an economic effect similar to increasing the number of people who actively spend within the local economy. In an era of population decline, tourists can serve as an external source of economic vitality and as a new consumption base that offsets shrinking domestic demand. Tourism can also play an important role in improving the profitability of local self-employed businesses facing oversupply.
Tourism is also a connective industry that stimulates multiple sectors simultaneously. A single tourist’s spending does not stop at the entrance fee; it spreads across accommodation, restaurants, cafés, transportation, traditional markets, local specialties, performance venues, experiential programs, and online booking platforms. Tourism is therefore a multifaceted industry that integrates accommodation, food and beverage, transportation, culture, content, shopping, digital platforms, and local services into a single experience.
Accordingly, the goal of Korean tourism policy should not be limited to increasing the number of visitors. The key question is no longer simply “How can we attract more people?” It is also “Who will come, why will they come, where will they go, how long will they stay, how much will they spend, and what memories will they take home?” Tourism is an ‘export industry without smokestacks,’ a domestic-demand industry that creates a consuming population, and a driver of balanced regional growth that can help reduce the gap between the Seoul metropolitan area and the rest of the country.
For this potential to be realized, however, one condition must first be met. We need an objective means of diagnosing where tourism cities currently stand; which cities are widely recognized but receive relatively low satisfaction ratings, and which generate high satisfaction despite remaining insufficiently known.
Until now, tourism policy and regional tourism evaluation in Korea have relied heavily on supply-side quantitative indicators, including visitor numbers, the number of tourist attractions, tourism expenditure, accommodation capacity, the volume of tourism resources, and transportation accessibility. These indicators are clearly useful in assessing a city’s basic capacity to accommodate tourists. Yet they do not fully explain why tourists choose a particular city, how they feel while they are there, whether they wish to return, or whether they would recommend the destination to others. This is comparable to evaluating the quality of healthcare based only on the size of a hospital and the amount of equipment it owns or assessing a dining experience solely by counting the number of seats and kitchen facilities in a restaurant.
As social media and personalized travel experiences reshape the nature of tourism, the competitiveness of a tourism city can no longer be explained by administrative data or infrastructure indicators alone. Tourists are no longer passive spectators. They actively immerse themselves in a city’s distinctive stories and atmosphere, share their experiences through photos, videos, reviews, and comments, and influence the choices of other potential visitors. A city’s competitiveness is now determined not only by what it possesses, but also by how people talk about it, how they feel about it, and how they remember it.
This change calls for a paradigm shift in the evaluation of tourism cities. Traditional assessments largely asked a supply-side question: “How well prepared is the city for tourism?” Future assessments must also ask: “How well do tourists know the city?” “How positively do they talk about it?” and “Does the experience remain as a memory that inspires a return visit?” Tourism city competitiveness should therefore be understood as a comprehensive, demand-oriented capability that extends beyond the volume of facilities and resources to encompass both Reputation/Awareness and Attractiveness.
Against this backdrop, Yanolja Research, in collaboration with the Center for Hospitality and Retail Industries Business Analytics (CHRIBA) at Purdue University and the H&T Analytics Center at Kyung Hee University, developed the Korea Tourism City Competitiveness Index. For broader use by industry practitioners and the public, the index was named the Yanolja City Competitiveness Index (YCCI).
YCCI is not simply a scorecard designed to rank cities. Rather, it is closer to a diagnostic health check for tourism cities—one that assesses the current state of competitiveness, identifies imbalances between reputation and attractiveness, and helps derive tailored strategic directions for individual destinations.
This report explains the theoretical significance of YCCI and the process through which it is measured and converted into an index. It also officially presents the results of the 2026 Korea Tourism City Competitiveness Assessment and discusses their implications for national tourism policy and regional tourism strategies. Furthermore, based on the differences in competitiveness identified across cities, the report offers practical guidance on what local governments should diagnose first, which visitor segments they should target, what kinds of experiences they should design, and how they can expand the resulting economic benefits within their communities.
Ultimately, this report poses one central question: In an era of population decline, why do some cities continue to be chosen while others are gradually forgotten?
The answer does not lie solely in building more facilities. It lies in a city’s ability to transform its assets into memorable visitor experiences—and in its capacity to interpret those experiences through data and continuously improve them.
YCCI provides a new analytical lens for enabling this transformation. It also serves as a strategic starting point for shifting regional tourism policy away from quantitative growth centered on visitor numbers and toward qualitative growth driven by experience, length of stay, spending, and repeat visitation.
How YCCI differs from existing tourism evaluation indicators
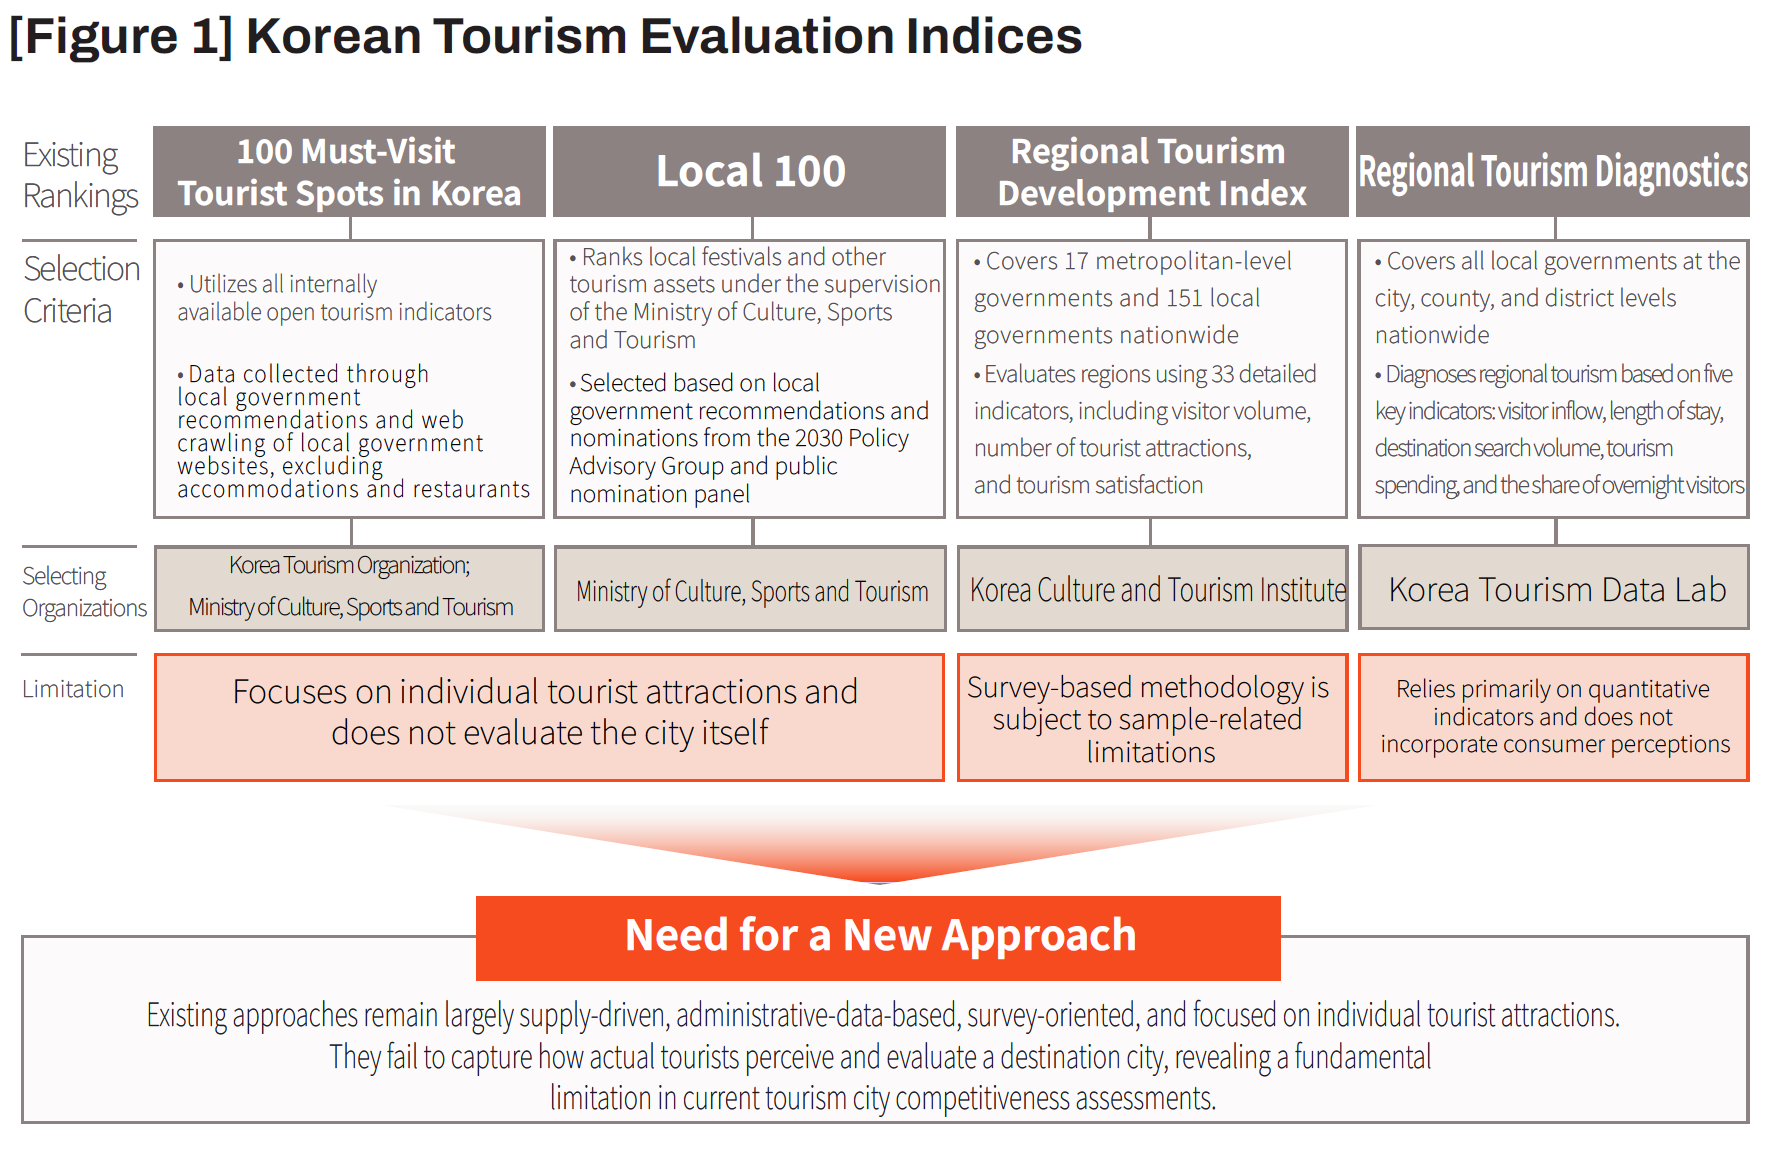
A wide range of indicators is already used to evaluate tourism cities. In Korea, these include the 100 Must-Visit Tourist Spots in Korea, Local 100, Regional Tourism Diagnostics, and the Regional Tourism Development Index. Each system serves a distinct policy purpose and offers its own advantages.
The 100 Must-Visit Tourist Spots in Korea helps promote representative destinations to domestic and international travelers, while Local 100 focuses on identifying lesser-known local content and everyday cultural assets. Regional Tourism Diagnostics provides insights into local tourism flows by examining indicators such as visitor inflows, length of stay, destination search volume, tourism expenditure, and the share of overnight visitors. Meanwhile, the Regional Tourism Development Index assesses the overall level of tourism development by integrating a broad range of indicators, including visitor numbers, the number of tourist attractions, and visitor satisfaction.
However, these evaluation systems have generally relied on supply-side administrative data, tourism resource inventories, visitor counts, facilities and infrastructure, surveys, or recommendation-based selection procedures. As a result, they have limitations in fully capturing how well tourists know a particular city, how positively they perceive it, and what kinds of emotions remain after the actual experience.
Whereas existing indicators primarily describe a city’s tourism supply base and visitor flows, YCCI seeks to identify the position a city occupies in tourists’ perceptions and lived experiences. The differences are summarized in Table 1.
Table 1. Comparison of major tourism evaluation indicators in Korea and the Yanolja City Competitiveness Index
| Category | 100 Must-Visit Tourist Spots in Korea | Local 100 | Regional Tourism Diagnostics | Regional Tourism Development Index | Yanolja City Competitiveness Index (YCCI) |
|---|---|---|---|---|---|
| Lead / Selecting Organization | Korea Tourism Organization; Ministry of Culture, Sports and Tourism | Ministry of Culture, Sports and Tourism | Korea Tourism Data Lab | Korea Culture and Tourism Institute | Yanolja Research; Purdue University CHRIBA; Kyung Hee University H&T Analytics Center |
| Unit of Analysis or Selection | Major tourist attractions in Korea | Local tourism assets, including festivals and local content | Local governments nationwide at the city, county, and district levels | 17 metropolitan-level governments and 151 local governments | Tourism cities and administrative districts nationwide |
| Major Criteria | Local government recommendations and crawling of local government websites, centered on tourist attractions | Local government recommendations and nominations by the 2030 Policy Advisory Group and public discovery panels | Five indicators: visitor inflows, length of stay, destination search volume, tourism expenditure, and share of overnight visitors | 33 detailed indicators, including visitor numbers, number of tourist attractions, and tourism satisfaction | Social big data–based Reputation and Attractiveness |
| Evaluation Perspective | Selection of outstanding tourist attractions | Discovery of distinctive local content | Diagnosis of current regional tourism conditions | Assessment of regional tourism development levels | Demand-oriented evaluation reflecting tourists’ perceptions and experiences |
| Primary Data Type | Recommendations, attraction lists, and public-sector data | Recommendations, discovery processes, and policy judgments | Quantitative data on visits, searches, expenditure, and related activity | Composite indicators combining administrative statistics, tourism resources, and satisfaction measures | Social data based on online mention volume and sentiment analysis |
| Strengths | Effective for promoting representative tourist attractions | Identifies hidden and distinctive local content | Provides an overview of tourism flows and expenditure by local government | Enables comprehensive comparisons of regional tourism development | Captures how tourists actually perceive and evaluate a city |
| Limitations | Attraction-level focus limits assessment of citywide competitiveness | Recommendation- and discovery-based methods constrain objective comparison | Visit-, search-, and expenditure-centered measures have limited ability to capture emotional experiences | Includes many supply-side variables and has limited ability to reflect real-time visitor experiences | Requires complementary interpretation for areas with low volumes of social-media mentions |
| Core Question | Which attractions represent Korea’s tourism offering? | Which local tourism assets deserve attention? | What is the current state of regional tourism activity? | What is the level of tourism development in the region? | How well do tourists know the city, and how positively do they evaluate it? |
This does not mean that existing indicators are unnecessary. On the contrary, they have played an important role in shaping tourism policy in Korea. However, they primarily capture a tourism city’s supply capacity, resource endowment, visitor flows, and policy performance. In other words, their strength lies in answering questions such as: How well prepared is the city to receive tourists? Which attractions serve as its representative tourism resources? How much visitation and tourism expenditure are being generated?
YCCI changes the direction of the question: What position does this city occupy in the minds and hearts of tourists? This is the most fundamental distinction between YCCI and existing tourism indicators. A city may possess an abundance of tourism resources, but it is unlikely to be chosen if it does not come to mind when travelers consider where to go. Likewise, even a city with large visitor counts may struggle to generate repeat visits and recommendations if the actual experience is not positive.
Tourism city competitiveness must therefore be assessed not only in terms of the quantity of resources and facilities a city possesses, but also according to how well tourists know the city, how positively they talk about it, and how strongly they wish to remember it.
By combining YCCI with existing tourism indicators, policymakers can develop a more comprehensive understanding of tourism cities—one that encompasses not only supply capacity and visitor flows, but also tourists’ perceptions and emotional responses. This can provide local governments with a stronger foundation for developing practical tourism strategies based on a more multidimensional diagnosis.
Reputation and Attractiveness: capturing both the mind and heart
YCCI operationalizes this demand-oriented perspective through two core dimensions: Reputation and Attractiveness.
Reputation indicates how frequently a particular city is mentioned, how widely it is known, and how much attention it receives among tourists. Even a city with excellent tourism resources may struggle to attract visitors if it does not come to mind as a potential destination. A destination must first become known before it can enter a traveler’s consideration set.
Attractiveness, by contrast, reflects how positively tourists evaluate the city. Some destinations may be widely known but fail to meet expectations once visited. Others may remain relatively unfamiliar while generating exceptionally high levels of satisfaction and positive feedback among those who do visit.
Put simply, Reputation concerns the question: “Do people want to visit?”; Attractiveness concerns the question: “Was the experience positive once they visited?” If Reputation is the power that places a city before the eyes of potential tourists, Attractiveness is the power that allows the city to remain in their hearts.
In this sense, YCCI is closer to a compass than a report card. A report card tells a city where it currently ranks; a compass indicates the direction in which it should move. The key issue in tourism policy is therefore not simply the city’s rank. Rather, policymakers must determine why the city occupies that position, what should be improved first, which strengths should be further developed, which visitor segments should be targeted, and how tourism outcomes can ultimately be translated into longer stays, greater expenditure, and repeat visitation within the local economy.
To evaluate tourism city competitiveness properly, we must first answer a fundamental question: What is tourism city competitiveness?
Tourism city competitiveness does not simply mean having many attractions, sufficient accommodation capacity, or high visitor volumes. These are certainly important foundational conditions for a tourism city. However, contemporary travel decisions are no longer determined solely by the number of facilities available or the extent of administrative preparedness.
Tourists form impressions of cities, imagine the kinds of experiences those cities may offer, and then evaluate and share those experiences after visiting. Tourism city competitiveness should therefore be understood as a city’s comprehensive ability to transform tourism resources and products into tourist awareness, emotion, choice, satisfaction, and recommendation.
Push-Pull Theory: the desire to travel and the power to attract
The first theoretical foundation of YCCI is Push-Pull Tourism Motivation Theory. Push factors refer to internal motivations such as the desire to escape daily routines, seek new experiences, achieve personal fulfillment, or relieve stress. These are the forces that encourage people to leave home. Pull factors, by contrast, refer to the external attributes of a destination that attract visitors, including natural scenery, cultural heritage, food, shopping, festivals, accessibility, and destination image. Tourism ultimately occurs when the desire to travel meets a compelling reason to visit a particular place.
Within YCCI, Reputation reflects the extent to which a city’s pull resources are recognized in the market. Natural landscapes, historical, cultural, and religious resources, architectural and aesthetic attractions, and recreation and leisure facilities represent major pull factors. The frequency with which these resources are mentioned in social data indicates the likelihood that the city will enter tourists’ consideration sets. Attractiveness, meanwhile, reflects how positively tourists evaluate the elements they consume and experience, including festivals and events, local tourism products, and experiential activities.
Destination Image Theory: knowing and liking
YCCI is also closely linked to Destination Image Theory. Tourists form two types of images of a destination at the same time. The first is a cognitive image, which is based on facts and information. Examples include: “Gyeongju is a city rich in historical and cultural heritage,” “Busan is known for the sea and its beaches,” “Jeonju is famous for hanok architecture and food.”
The second is an affective image, which is based on atmosphere and emotion. Examples include: “Gangneung feels relaxed and emotionally engaging,” “Gwangalli feels vibrant and romantic,” “Seongsu-dong feels trendy and sophisticated.”
Tourists’ actual destination choices are shaped through the interaction of these two types of images. A traveler may know a great deal about a city without feeling emotionally drawn to it. Conversely, a traveler may know relatively little about a place but develop a strong sense of affinity through another person’s positive story, photographs, or reviews. Within YCCI, Reputation is associated with a city’s cognitive image, while Attractiveness is associated with its affective image.
Resource-Based View: resources become competitive when they are translated into experiences
The meaning of YCCI becomes even clearer when viewed through the lens of the Resource-Based View (RBV). The Resource-Based View holds that sustainable competitive advantage arises from resources that are valuable, rare, difficult to imitate, and difficult to substitute. Tourism cities are particularly relevant from this perspective because tourism resources are deeply embedded in place. The historical depth of Gyeongju, Jeju’s natural environment and culture, Jeonju’s hanok architecture and cuisine, Gangneung’s coastline and coffee culture, and the Gwangalli waterfront experience in Busan’s Suyeong-gu are not easily replicated by other cities.
However, simply possessing resources does not create competitiveness. Resources generate tourism competitiveness only when they are transformed into experiences. Many cities may have a coastline, but some convert that resource into a distinctive visitor experience by combining nightscapes, drone shows, marine leisure activities, café districts, and walkable waterfront spaces. The same principle applies to historical heritage. The presence of old buildings alone is not enough. Heritage becomes a memorable tourism experience when it is integrated with interpretation, visitor routes, food, accommodation, festivals, and nighttime content.
YCCI therefore does not measure only the volume of resources a city possesses. It evaluates how widely those distinctive resources are recognized by tourists and how successfully they are translated into positive visitor experiences. This approach understands tourism city competitiveness as a continuous process: Resources → Experiences → Emotions → Sharing → Potential Repeat Visitation.
.
Research design: capturing tourist voices through data
The theoretical framework outlined above acquires practical and policy relevance only when it is translated into empirical analysis. To measure tourism city competitiveness from a demand-side perspective, it is necessary to identify which cities and tourism resources tourists discuss, as well as how positively they evaluate those experiences. The research design of YCCI was developed in response to this need.
YCCI is not an index created by simply aggregating supply-side data such as administrative statistics, the number of tourism facilities, budget size, or visitor counts. Rather, it is a social big data–based evaluation framework that measures a city’s Reputation and Attractiveness through the voluntary responses expressed by tourists in online spaces.
The analysis covers 255 administrative districts nationwide and 29,336 tourist attractions and festivals. Rather than evaluating only a limited number of well-known destinations or representative cities, the study was designed to compare tourism cities across the country using a common analytical framework.
Evaluation at the administrative-district level is also important from a policy perspective, since tourism policies are generally formulated and implemented by local governments. A comparable diagnosis of each city’s strengths and weaknesses can provide practical support for tourism strategy development, budget allocation, content development, and promotional planning.
The data collection period covered the most recent one-year period, from April 2025 to April 2026. Tourism trends can change substantially even over relatively short periods due to seasonality, festivals, media exposure, changes in transportation conditions, and the diffusion of content through social media. Accordingly, rather than reflecting only reputations accumulated over a long period, the study sought to capture the attention and emotional responses that were formed in online spaces during the most recent year. This means that YCCI reflects not only a city’s historical standing, but also its current level of market visibility and the way recent visitor experiences are being evaluated.
Data were collected from major social platforms, including YouTube, Instagram, blogs, Facebook, X, and online communities. These platforms serve as key digital spaces in which tourists search for information before traveling, share experiences during their trips, and express evaluations and emotions after returning. Mentions and reactions appearing on social platforms therefore provide valuable evidence for understanding tourists’ actual perceptions and experiences.
However, not all online data are suitable for evaluating tourism city competitiveness. The study excluded promotional materials unrelated to the research objective, as well as news content centered on specific incidents or issues. Official promotional materials are more likely to reflect the image that a city intends to project, while news data may contain short-term discourse generated by particular events or controversies. YCCI, by contrast, is designed to capture not the image communicated by the city itself, but the perceptions and emotions voluntarily expressed by tourists and general users based on their actual experiences.
The data collected was classified around keywords related to tourism destinations and tourism products. The volume of mentions associated with each keyword—referred to as buzz volume—was then converted into a city’s Reputation score, while the share of positive sentiment within those mentions was converted into its Attractiveness score. Put simply, YCCI measures two things simultaneously: how much a city is being talked about, and how positively it is being talked about.
The data collection and analysis process was supported by the technology of VAIV Company, which has particular expertise in Korean-language social big data analytics. Evaluating Korean tourism cities requires a detailed understanding of the context of Korean online discourse, patterns of expression, sentiment-related vocabulary, and platform-specific characteristics of online mentions. The study therefore went beyond a simple count of keyword frequency and incorporated procedures for analyzing how cities and tourism resources were discussed and evaluated within tourism-related contexts.
The YCCI analytical framework consists of two overarching dimensions and seven sub-dimensions. The two primary dimensions are: Reputation and Attractiveness. Reputation indicates how actively a city is discussed within tourism-related discourse, while Attractiveness reflects how positively tourists evaluate their experiences in the city. In other words, if Reputation represents a city’s level of visibility and attention in the market, Attractiveness represents the degree of satisfaction and positive sentiment associated with actual visitor experiences.
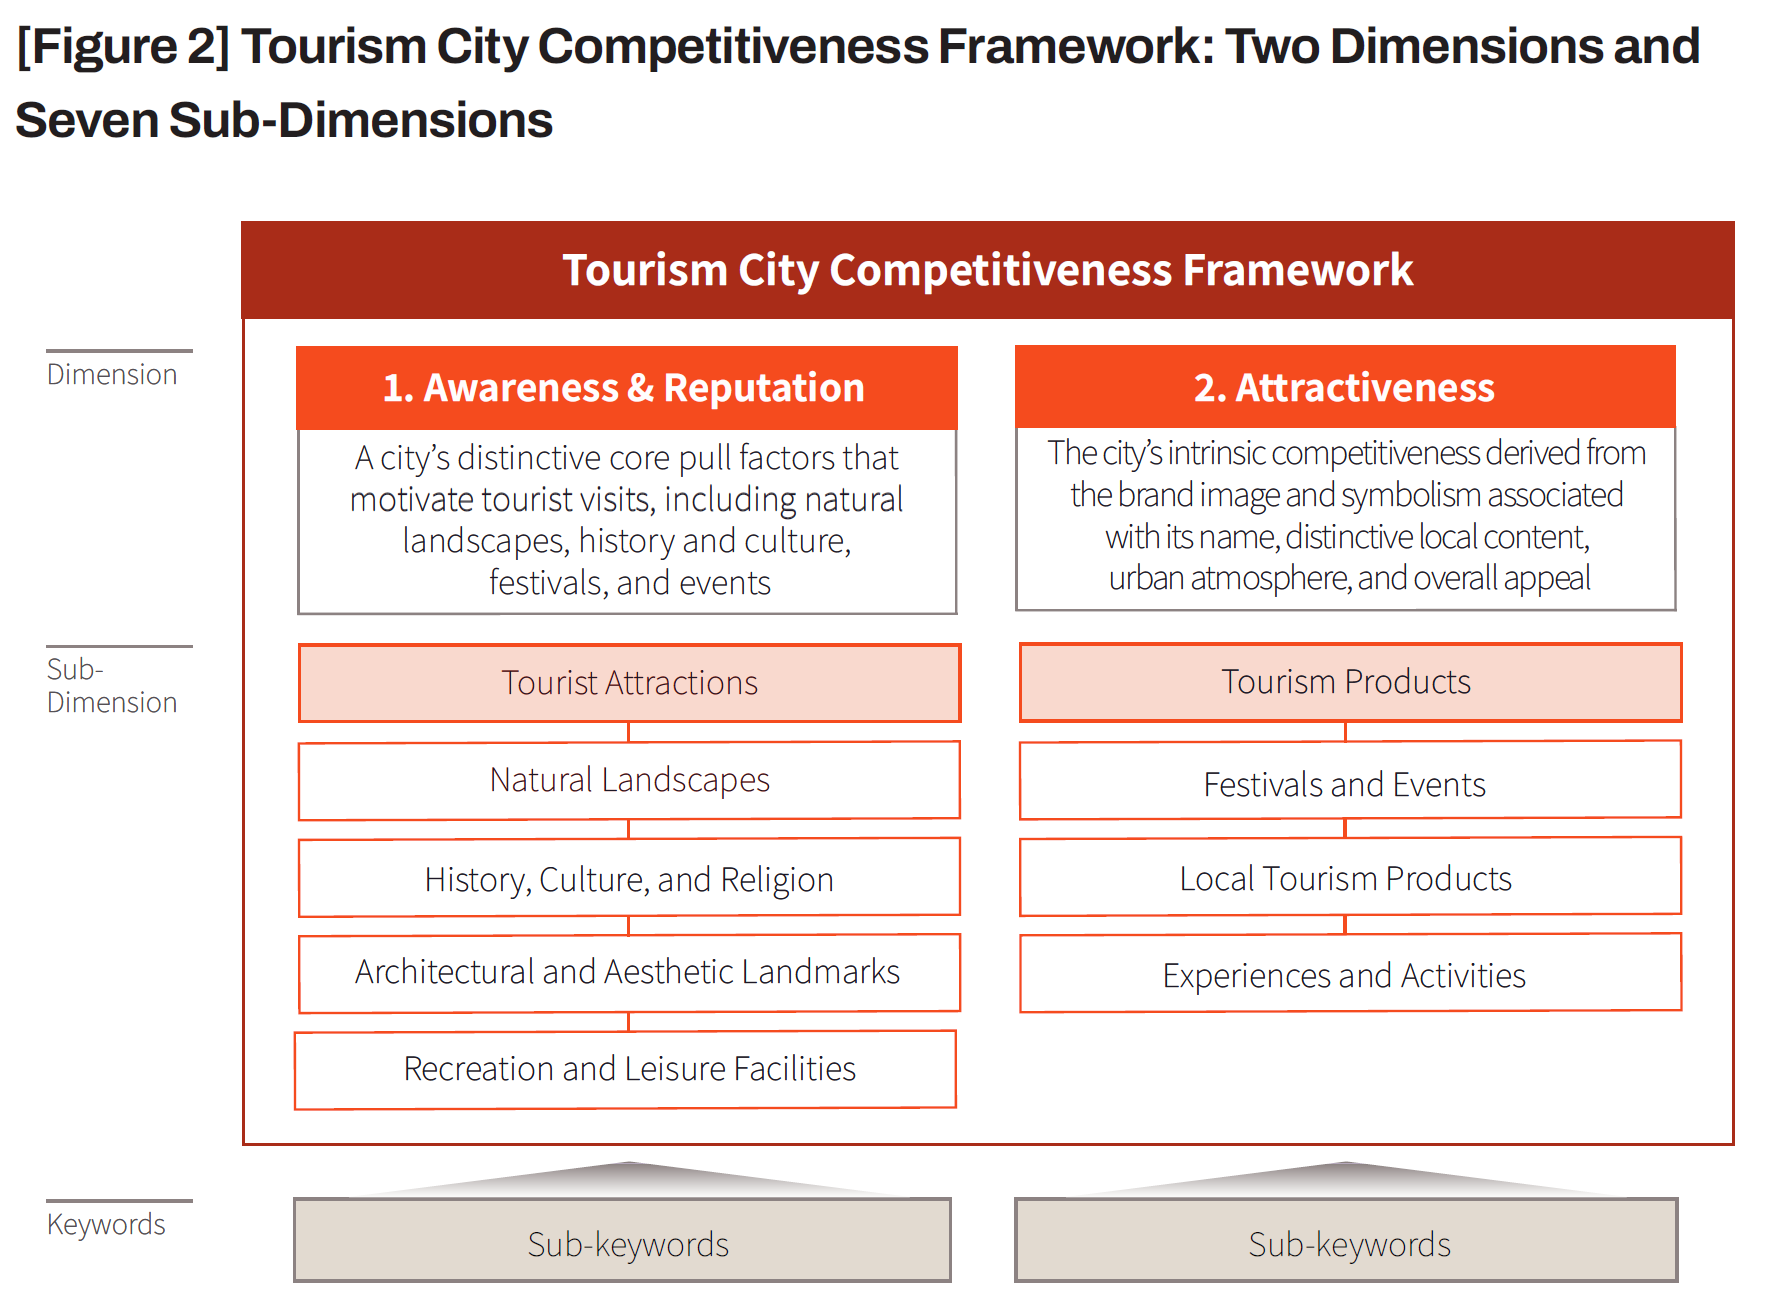
The seven sub-dimensions are:
These seven sub-dimensions provide a multidimensional framework for understanding tourism city competitiveness. Natural landscapes; historical, cultural, and religious resources; architectural and aesthetic attractions; and recreation and leisure facilities are closely related to the core pull resources that motivate tourists to visit a city. Festivals and events, experiences and activities, and local tourism products, by contrast, represent the mechanisms through which a city transforms its existing resources into actual tourism experiences.
YCCI therefore does not assess only whether a city possesses tourism resources. It also examines how widely those resources are recognized by tourists and how positively they are received through actual visitor experiences. The core elements of the research design are summarized in Table 2.
Table 2. Summary of the YCCI Research Design
| Category | Description |
|---|---|
| Research Objective | To develop a social big data–based index for evaluating the competitiveness of tourism cities in Korea |
| Units of Analysis | 255 administrative districts and 29,336 tourist attractions and festivals nationwide |
| Data Period | Most recent one-year period, April 2025–April 2026 |
| Data Sources | YouTube, Instagram, blogs, Facebook, X, online communities, and other social platforms |
| Analytical Method | Reputation calculated from buzz volume; Attractiveness calculated from positive sentiment ratios |
| Data Provider | VAIV Company |
Modeling Tourism City Competitiveness
Tourism city competitiveness modeling refers to the process of cleaning and analyzing the collected social data and converting them into a measurable index. YCCI does not simply assign higher rankings to cities with larger volumes of online mentions. Genuine competitiveness requires both broad recognition and positive visitor experiences. The model therefore integrates: how much is the city being discussed (Reputation) and how positively is the city being discussed (Attractiveness).
The first step is to clean the collected social data and convert them into an analytically usable format. Official promotional materials, news centered on isolated incidents or issues, and other data unrelated to the research objective were excluded. Only voluntary responses generated by tourists and general users were retained for analysis.
The cleaned data were then classified not simply by city name, but according to tourism resource- and tourism product-related keywords across the seven sub-dimensions. This approach makes it possible to identify the specific tourism-related elements for which each city receives strong visibility and positive evaluations.
Reputation is based on Buzz Volume, which indicates how frequently a particular tourism city is mentioned in online spaces. Buzz volume was calculated by city and by sub-dimension, after which the results were normalized on a scale from 1 to 10.
Reputation Scoreᵢ = Normalized Buzz Volumeᵢ
This score reflects not visitor volume or the scale of tourism facilities, but how frequently a city comes to mind and becomes a topic of discussion within tourists’ perceptions.
Attractiveness is based on the Positive Sentiment Ratio, which indicates how positively a tourism city is evaluated. The ratio represents the share of positive responses among all mentions. The results of the sentiment analysis were likewise normalized on a scale from 1 to 10.
Attractiveness Scoreᵢ = Normalized Positive Sentiment Ratioᵢ
A city may receive a low score even when it generates a large volume of mentions if many of those mentions reflect negative experiences. Conversely, a city may achieve a high score despite relatively limited online exposure if the evaluations it receives are predominantly positive. The score therefore reflects how positively a city is evaluated by those who have experienced it.
To reduce potential bias arising from differences in city size—particularly between large metropolitan areas and smaller cities—the raw values described above, including buzz volume and positive sentiment ratios, were normalized to a scale ranging from 1 to 10.
Normalized Scoreᵢ = 1 + 9 × {(Raw Valueᵢ − Minimum Raw Value) / (Maximum Raw Value − Minimum Raw Value)}
A city with the lowest raw value receives a score close to 1, while a city with the highest raw value receives a score close to 10. This process places all 255 administrative districts on a common scale and enables more accurate comparisons of their relative positions.
The final YCCI score is calculated by assigning equal weight to Reputation and Attractiveness. This reflects the principle that tourism competitiveness requires a balance between being widely recognized and being positively experienced.
YCCIᵢ = (0.5 × Reputation Scoreᵢ) + (0.5 × Attractiveness Scoreᵢ)
For example, a city with a Reputation score of 8 and an Attractiveness score of 6 would receive the same final YCCI score of 7.0 as a city with a Reputation score of 5 and an Attractiveness score of 9. However, the strategic implications for the two cities would be very different. The first city would need to focus primarily on improving the quality of the visitor experience, while the second would need to strengthen branding, visibility, and market reach.
The final rankings are determined by combining the two dimensions at a 50:50 ratio and arranging all 255 administrative districts in descending order of their composite YCCI scores.
Table 3. Tourism City Competitiveness Modeling Process
| Stage | Key Activities | Output |
|---|---|---|
| Stage 1. Data Collection | Collection of social data related to 255 administrative districts and 29,336 tourist attractions and festivals | Raw social data by city and tourism resource |
| Stage 2. Data Cleaning | Removal of promotional materials, incident- and issue-centered news, and data unrelated to the research objective | Tourism-related data suitable for analysis |
| Stage 3. Keyword Classification | Classification into natural landscapes; history, culture, and religion; architectural and aesthetic attractions; recreation and leisure facilities; festivals and events; experiences and activities; and local tourism products | City-level data by sub-dimension |
| Stage 4. Buzz Volume Calculation | Calculation of the volume of mentions by city and sub-dimension | Base values for Reputation scores |
| Stage 5. Sentiment Analysis | Calculation of positive sentiment ratios by city and sub-dimension | Base values for Attractiveness scores |
| Stage 6. Normalization | Conversion of raw values into comparable scores across cities | Reputation and Attractiveness scores on a 1–10 scale |
| Stage 7. Composite Index Calculation | Integration of Reputation and Attractiveness scores | Final YCCI scores and rankings |
Interpreting YCCI scores and their strategic applications
A key strength of YCCI is that it presents tourism city competitiveness not simply as an overall ranking, but through the relative positioning of Reputation and Attractiveness. This allows each city to diagnose its competitive profile more clearly and derive a tailored strategic direction.
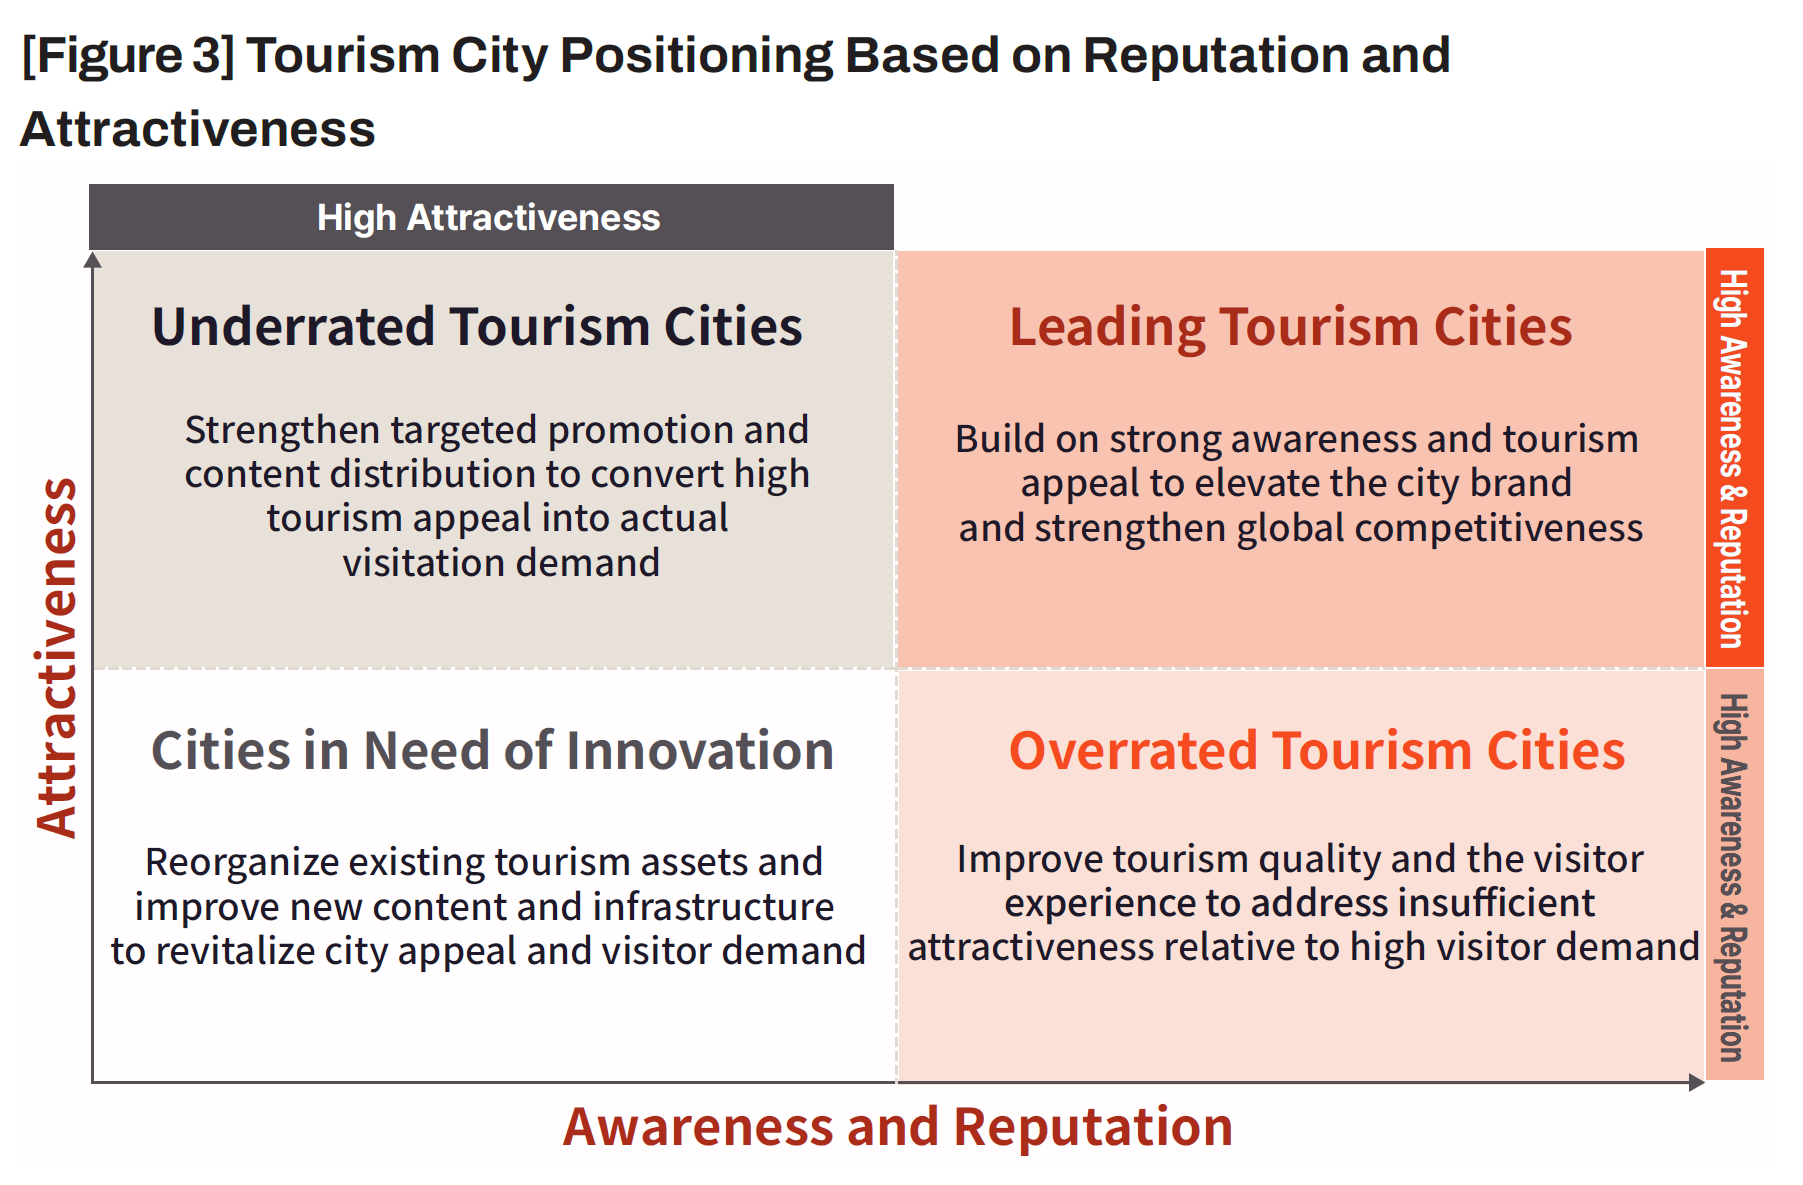
YCCI therefore functions not merely as a ranking table, but as a strategic map that serves as a compass through its detailed diagnostic scores. Furthermore, analysis of the seven sub-dimensions enables cities to identify specific strengths in areas such as natural landscapes, history and culture, festivals, and local tourism products. This allows destinations to move away from uniform tourism policies and develop differentiated strategies based on their own competitive advantages.
Whereas traditional indicators tend to focus on the quantity of resources possessed, YCCI measures the extent to which those resources are converted into Reputation and Attractiveness. This is possible because YCCI incorporates actual stages in tourists’ decision-making processes—including videos, reviews, images, and emotional responses—rather than relying exclusively on administrative data. Ultimately, YCCI is a practical strategic model that objectively diagnoses a city’s current position and supports the development of demand-oriented tourism competitiveness.
The competitiveness results for all 255 administrative districts derived from the YCCI model are presented through a tier-based classification system, rather than as a single comprehensive ranking table. This approach is intended to provide a more intuitive understanding of where each city stands within Korea’s tourism competitiveness landscape and what strategic direction it should pursue. The assessment classifies cities into four categories: 1st Tier City, 2nd Tier City, 3rd Tier City, and Candidate City.
Table 4. Tier Classification for the Korea Tourism City Competitiveness Assessment
| Classification | Overall Ranking | Meaning | Strategic Direction |
|---|---|---|---|
| 1st Tier City | 1–50 | Leading tourism cities with the highest levels of competitiveness in Korea | Maintain competitiveness, extend length of stay, increase value added, and spread benefits to surrounding areas |
| 2nd Tier City | 51–100 | Upper-middle-tier tourism cities with an established competitive foundation | Strengthen advantages, address weaknesses, and develop strategies for entering the 1st Tier |
| 3rd Tier City | 101–150 | Mid-tier tourism cities with growth potential | Identify core resources, develop tourism content, and improve visibility |
| Candidate City | 151–255 | Cities with potential that have not yet entered the 3rd Tier | Diagnose foundational competitiveness, develop tourism products, strengthen branding, and improve accessibility |
This tier system provides clear, stage-specific strategic objectives. Cities in the 1st Tier, which already possess strong competitiveness, should focus on expanding tourism spillover effects and developing higher-value offerings. Cities in the 2nd and 3rd Tiers should prioritize strategic focus and the discovery of distinctive local content in order to advance into higher tiers.
In particular, cities ranked 151st or below are grouped together as Candidate Cities, and their individual rankings are not disclosed. This approach is intended to prevent the stigmatizing effects that may result from publishing low rankings and instead provide these cities with a positive opportunity to strengthen their foundational capabilities, including tourism resource development, branding, and accessibility.
As a result, the tier-based reporting system enables YCCI to function as a practical policy diagnostic framework. Each city can use its assigned tier to determine which capabilities should be improved first and to design more specific tourism policies and industry strategies for advancing to the next stage.
The overall rankings, Reputation rankings, Attractiveness rankings, and regional rankings generated through this study are presented in the appendix to this report.
While concentrated in the Seoul Metropolitan Area, it is not the single source of competitiveness
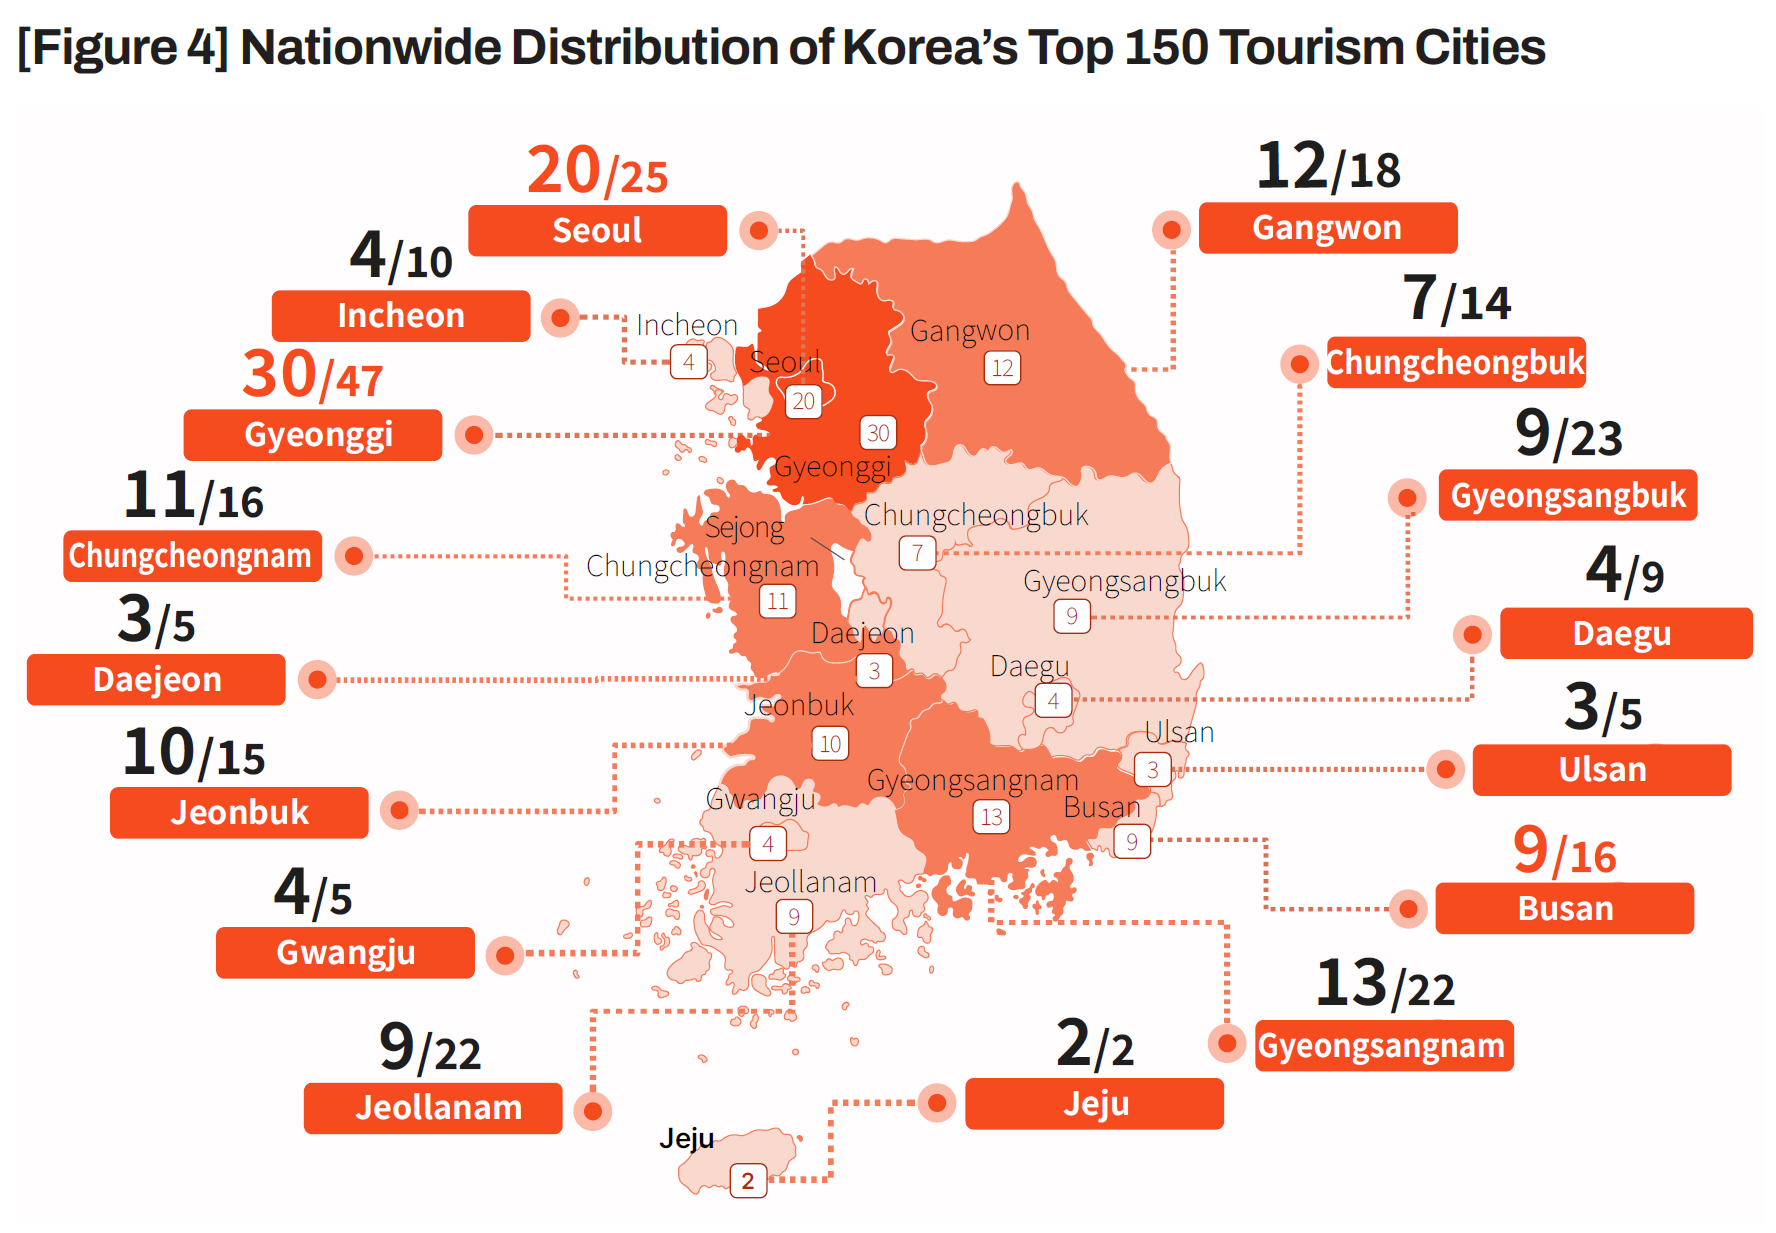
The results of the 2026 Korea Tourism City Competitiveness Assessment provide a relatively clear picture of the current structure of regional tourism in Korea. Among the 255 administrative districts evaluated, the regional distribution of cities ranked within the Top 150 shows that Gyeonggi Province accounted for the largest number, with 30 districts, followed by Seoul with 20. Gyeongsangnam-do had 13 districts, Gangwon State 12, Chungcheongnam-do 11, and Jeonbuk State 10. These results indicate that tourism city competitiveness in Korea continues to be strongly influenced by population size, accessibility, transportation infrastructure, and the scale of consumer markets concentrated in the Seoul metropolitan area.
However, it would be insufficient to interpret the findings simply as evidence that “the capital region is stronger.” The substantial representation of non-metropolitan regions—including Gangwon, Chungcheongnam-do, Jeonbuk, and Gyeongsangnam-do—within the Top 150 is also significant. This suggests that tourism city competitiveness is not determined solely by population size or metropolitan status. Distinctive local assets, including natural landscapes, marine resources, historical and cultural heritage, and local content, can also serve as powerful sources of competitiveness.
In other words, the Seoul metropolitan area benefits from the strength of market accessibility, while non-metropolitan regions draw strength from place-based distinctiveness. Competitive tourism cities can therefore be understood as places that either possess one of these two advantages to a particularly high degree or combine both effectively.
The Geographical Structure Revealed by the Top 150
The regional distribution of Korea’s Top 150 tourism cities is summarized in Table 5.
Table 5. Regional Distribution and Interpretation of Korea’s Top 150 Tourism Cities
| Region | Number in Top 150 / Total Administrative Districts | Interpretation |
|---|---|---|
| Gyeonggi Province | 30 / 47 | Strong demand from the broader capital region and growth of nearby leisure travel |
| Seoul | 20 / 25 | Concentration of urban tourism, shopping, culture, and lifestyle content |
| Gyeongsangnam-do | 13 / 22 | Competitiveness based on coastal, island, historical, and cultural resources |
| Gangwon State | 12 / 18 | Strong natural landscape and resort-oriented tourism |
| Chungcheongnam-do | 11 / 16 | Combination of marine tourism, historical and cultural assets, and accessibility from the capital region |
| Jeonbuk State | 10 / 15 | Strength in historical and cultural heritage, gastronomy, and traditional content |
| Busan | 9 / 16 | Competitiveness rooted in urban coastal tourism |
| Gyeongsangbuk-do | 9 / 23 | Historical, cultural, and natural-resource-based tourism |
| Jeollanam-do | 9 / 22 | Strong potential in marine, ecological, and culinary tourism |
| Jeju Special Self-Governing Province | 2 / 2 | Both administrative districts ranked within the Top 150 |
The most visible feature of this distribution is the concentration in the Seoul metropolitan area. Seoul and Gyeonggi together account for 50 of the Top 150 districts, or one-third of the total. Because tourism is fundamentally based on human mobility and consumption, it is natural for regions with large populations and strong accessibility to demonstrate high levels of competitiveness. Tourism destinations in Seoul and Gyeonggi benefit from their location within the daily activity zones of large numbers of potential visitors, as well as convenient access through extensive public transportation and road networks.
At the same time, however, the presence of non-metropolitan regions such as Gangwon, Chungcheongnam-do, Jeonbuk, and Gyeongsangnam-do is also substantial. In Gangwon, 12 of 18 administrative districts were included in the Top 150. Chungcheongnam-do had 11 of 16 districts, while Jeonbuk had 10 of 15. These results demonstrate that non-metropolitan tourism cities build competitiveness through mechanisms that differ from those of the capital region. Gangwon draws primarily on mountains, coastlines, resorts, and leisure resources. Jeonbuk builds competitiveness around traditional culture and gastronomy. Chungcheongnam-do combines marine tourism with historical and cultural assets, while Gyeongsangnam-do draws on coastal landscapes, islands, and tourism resources along Korea’s southern coast.
The Top 150 distribution therefore highlights two major foundations of tourism city competitiveness in Korea: Competitiveness based on accessibility to the Seoul metropolitan market Competitiveness based on distinctive local resources. Future regional tourism strategies should distinguish between these two foundations. Cities in the capital region should further develop lifestyle-oriented leisure, shopping, cultural experiences, and mixed-use urban spaces. Non-metropolitan destinations, meanwhile, should strengthen competitiveness by transforming distinctive local resources into longer-stay visitor experiences.
What the 1st Tier reveals about the conditions for top-level competitiveness
When the scope is narrowed to the 1st Tier, comprising cities ranked from 1st to 50th overall, concentration in the Seoul metropolitan area becomes even more pronounced. Of the 50 cities in the 1st Tier, 11 are located in Seoul and 10 in Gyeonggi Province, meaning that Seoul and Gyeonggi together account for 21 cities. Gangwon has six cities in the 1st Tier, demonstrating strong competitiveness based on natural landscapes and resort-oriented tourism resources. Both administrative districts in Jeju Special Self-Governing Province—Jeju City and Seogwipo City—were included in the 1st Tier. In Busan, Suyeong-gu and Haeundae-gu entered the Top 50.
The composition of the 1st Tier indicates that Korea’s most competitive tourism cities can be broadly grouped into four types:
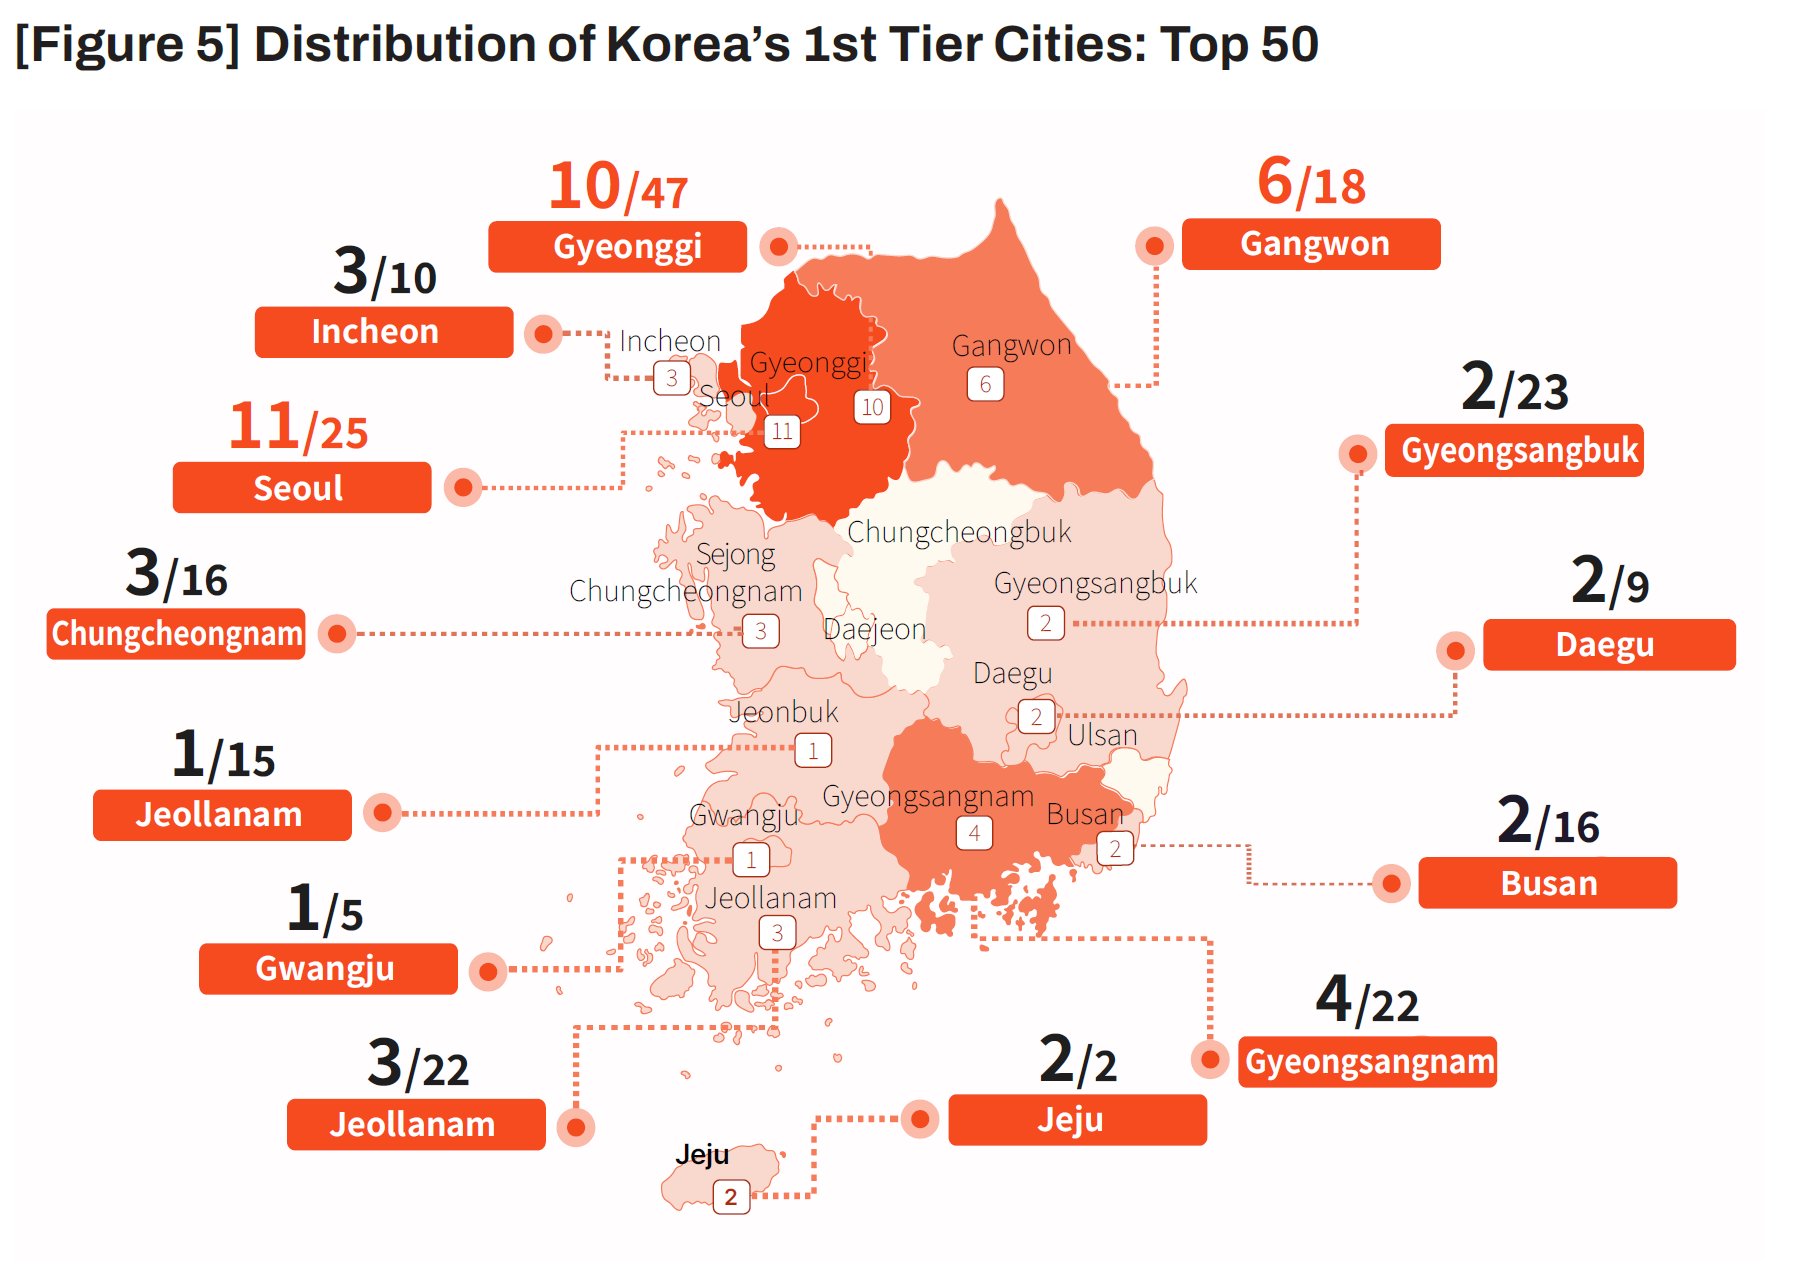
These findings show that tourism city competitiveness can no longer be explained through a single formula. In the past, famous attractions and historical and cultural resources were often regarded as the primary foundations of competitiveness. Today, however, urban lifestyle districts, waterfront spaces, parks, café streets, pop-up stores, nightscapes, and experiential content have also become powerful tourism resources. The stage on which tourism takes place is expanding from individual attractions to the city as a whole experience.
Songpa-gu, ranked no. 1 overall: strong competitiveness created through a diverse mix of experiences
Songpa-gu in Seoul ranked first overall. It recorded a Reputation score of 9.37 and an Attractiveness score of 8.72, demonstrating strong performance across both dimensions. Lotte World, Seokchon Lake, and Olympic Park each serve distinct functions: a theme park, a waterfront and seasonal landscape, and a large-scale urban park. Together, these three assets create a diverse and integrated tourism experience that can appeal to families, couples, groups of friends, and international visitors within a single administrative district.
The case of Songpa-gu demonstrates that city competitiveness becomes stronger when multiple tourism assets operate in complementary ways rather than depending on a single landmark. If a tourism city were compared to a department store, Songpa-gu would resemble a structure in which several flagship stores operate successfully across multiple floors, rather than one in which only a single store performs well. Parks and the lake shape daytime experiences; night views and shopping extend activities into the evening; and theme parks and events generate additional reasons to visit on weekends. Together, these elements create a wide range of motivations for visitation.
Suyeong-gu, Busan: what the highest attractiveness score reveals about the power of experience
Suyeong-gu in Busan ranked second overall and recorded the highest Attractiveness score in the country, at 10.00. This result can be understood as the outcome of combining the strong waterfront scenery of Gwangalli Beach and Gwangan Bridge with drone shows, nightscapes, marine leisure activities, cafés, and a vibrant food and beverage district.
The case of Suyeong-gu illustrates that, in tourism city competitiveness, the ability to transform scenery into an experience may be more important than the scenery itself. Many cities have coastlines, but not every coastline generates the same degree of appeal. At Gwangalli, the beach, bridge, nightscape, events, dining, walking, and photography come together to create a distinctive scene. Visitors do not simply go there to see the sea. They enter the scene, capture it in photographs, and share the emotions associated with the experience. This is the key factor underlying Suyeong-gu’s exceptionally high Attractiveness score.
Although Suyeong-gu records a relatively high Reputation score of 7.91, it remains comparatively lower than its Attractiveness score. This suggests that Suyeong-gu already offers a strong visitor experience and has substantial potential for further growth by enhancing its global recognition and strengthening its city brand.
The Changing Nature of Urban Tourism: The Significance of Seongdong-gu, Yeongdeungpo-gu, and Jung-gu, Daegu
Yeongdeungpo-gu in Seoul, ranked third overall; Seongdong-gu in Seoul, ranked fourth; and Jung-gu in Daegu, ranked fifth, illustrate the changing nature of urban tourism. Traditionally, tourist destinations were centered on clearly defined attractions such as royal palaces, natural landscapes, and museums. More recently, however, tourists have responded strongly to urban content that combines everyday consumption with tourism experiences—including dining, shopping, walking, pop-up stores, cultural spaces, photography, night views, and the atmosphere of city streets.
The strong evaluations received by places such as Seongsu-dong, Yeouido Hangang Park, Mullae Art Village, Dongseong-ro, Seomun Market, and Kim Gwang-seok Street indicate that the boundaries of tourism are expanding into everyday leisure and lifestyle consumption. Tourists are now concerned not only with “What is there to see?” but also with “What kind of atmosphere can I spend time in?” This shift has important implications for local tourism strategies. The future competitiveness of urban tourism may depend less on constructing a single large-scale facility and more on creating an integrated environment that combines walkable streets, photogenic scenes, cafés and shops where visitors want to linger, and distinctive local stories and culture.
Table 6. Top 20 Tourism Cities by Overall Competitiveness
| Rank | Region | Administrative District | Representative Attractions and Tourism Assets | Reputation |
|---|---|---|---|---|
| 1 | Seoul | Songpa-gu | Lotte World, Seokchon Lake, Olympic Park | 9.37 |
| 2 | Busan | Suyeong-gu | Gwangalli Beach, Geumnyeonsan Mountain, Suyeong Paldo Market | 7.91 |
| 3 | Seoul | Yeongdeungpo-gu | Yeouido Hangang Park, 63 Square, Mullae Art Village | 8.93 |
| 4 | Seoul | Seongdong-gu | Seoul Forest, Eungbongsan Mountain, Seongsu-dong | 8.02 |
| 5 | Daegu | Jung-gu | Dongseong-ro, Seomun Market, Kim Gwang-seok Street | 8.90 |
| 6 | Gyeongsangbuk-do | Gyeongju | Hwangnidan-gil, Bulguksa Temple, Cheomseongdae Observatory | 9.28 |
| 7 | Jeju Special Self-Governing Province | Seogwipo | Hallasan National Park, Seongsan Ilchulbong, Jungmun Tourist Complex | 9.67 |
| 8 | Busan | Haeundae-gu | Dalmaji-gil Road, Haeundae Beach, Cheongsapo | 8.28 |
| 9 | Gangwon State | Gangneung | Gangneung Jungang Market, Gyeongpodae Pavilion, Jeongdongjin | 8.67 |
| 10 | Seoul | Gangnam-gu | Apgujeong Rodeo Street, Garosu-gil, Goto Mall | 8.50 |
| 11 | Jeonbuk State | Wansan-gu, Jeonju | Jeonju Hanok Village, Jeondong Cathedral, Nambu Market | 7.90 |
| 12 | Jeju Special Self-Governing Province | Jeju City | Hallasan Mountain, Udo Island, Hamdeok Beach | 9.30 |
| 13 | Seoul | Jongno-gu | Gyeongbokgung Palace, Bukchon, Gwanghwamun Square | 10.00 |
| 14 | Gangwon State | Sokcho | Seoraksan National Park, Sokcho Beach, Daepo Port | 8.19 |
| 15 | Gangwon State | Chuncheon | Nami Island, LEGOLAND, Samaksan Mountain Cable Car | 7.61 |
| 16 | Gyeonggi Province | Gapyeong-gun | Jarasum Island, Garden of Morning Calm, Petite France | 7.15 |
| 17 | Incheon | Yeonsu-gu | Songdo Central Park, Triple Street, Munhaksan Mountain | 7.09 |
| 18 | Seoul | Yongsan-gu | Namsan Mountain, National Museum of Korea, Haebangchon Sinheung Market | 8.65 |
| 19 | Gangwon State | Hongcheon-gun | Vivaldi Park, Palbongsan Mountain, Sutasa Temple | 7.00 |
| 20 | Seoul | Seocho-gu | Seoul Arts Center, Hangaram Art Museum, National Gugak Center | 7.01 |
Imbalances Between Reputation and Attractiveness: implications from Jongno-gu and Dongtan-gu
The rankings also reveal that high Reputation does not necessarily translate into high Attractiveness. Jongno-gu in Seoul ranked first nationwide in Reputation, with a score of 10.00, but recorded a comparatively lower Attractiveness score of 6.30.
This suggests that although Jongno-gu possesses highly recognizable tourism assets, the quality of the actual visitor experience may not fully match the level of awareness and expectations associated with the destination. For cities of this type, additional promotion may be less urgent than improving the quality of the visitor experience. Strategic priorities may include strengthening visitor circulation, reducing congestion, improving convenience, expanding nighttime content, and increasing opportunities for tourists to stay longer and spend more locally.
By contrast, Dongtan-gu in Hwaseong recorded a very high Attractiveness score of 9.22, while its Reputation score remained at 6.08. This indicates that visitors respond positively to its lifestyle-oriented waterfront areas, parks, and mixed-use leisure spaces, but that these assets have not yet developed into a widely recognized national or international tourism brand. Dongtan-gu can therefore be regarded as an undervalued destination with strong appeal. For cities of this type, large-scale investment in new facilities may be less effective than strengthening the visibility of experiences that are already positively evaluated and developing them into a more recognizable brand through connections with surrounding destinations.
This illustrates one of YCCI’s principal strengths. Rather than merely showing where cities rank, the index distinguishes between cities that are widely known but require improvements in visitor experience and cities that already offer positive experiences but need greater visibility.
Table 7. Top 20 Tourism Cities by Reputation
| Rank | Region | Reputation Score |
|---|---|---|
| 1 | Jongno-gu, Seoul | 10.00 |
| 2 | Seogwipo-si, Jeju Special Self-Governing Province | 9.67 |
| 3 | Songpa-gu, Seoul | 9.37 |
| 4 | Jeju-si, Jeju Special Self-Governing Province | 9.30 |
| 5 | Gyeongju-si, Gyeongsangbuk-do | 9.28 |
| 6 | Jung-gu, Seoul | 9.11 |
| 7 | Yeongdeungpo-gu, Seoul | 8.93 |
| 8 | Jung-gu, Daegu | 8.90 |
| 9 | Gangneung-si, Gangwon State | 8.67 |
| 10 | Yongsan-gu, Seoul | 8.65 |
| 11 | Gangnam-gu, Seoul | 8.50 |
| 12 | Haeundae-gu, Busan | 8.28 |
| 13 | Cheoin-gu, Yongin-si, Gyeonggi Province | 8.26 |
| 14 | Sokcho-si, Gangwon State | 8.19 |
| 15 | Jung-gu, Incheon | 8.04 |
| 16 | Mapo-gu, Seoul | 8.03 |
| 17 | Seongdong-gu, Seoul | 8.02 |
| 18 | Suyeong-gu, Busan | 7.91 |
| 19 | Wansan-gu, Jeonju-si, Jeonbuk State | 7.90 |
| 20 | Yeosu-si, Jeollanam-do | 7.81 |
Table 8. Top 20 Tourism Cities by Attractiveness
| Rank | Region | Attractiveness Score |
|---|---|---|
| 1 | Suyeong-gu, Busan | 10.00 |
| 2 | Seongdong-gu, Seoul | 9.44 |
| 3 | Dongtan-gu, Hwaseong-si, Gyeonggi Province | 9.22 |
| 4 | Wansan-gu, Jeonju-si, Jeonbuk State | 8.96 |
| 5 | Haeundae-gu, Busan | 8.91 |
| 6 | Gapyeong-gun, Gyeonggi Province | 8.86 |
| 7 | Yeonsu-gu, Incheon | 8.77 |
| 8 | Songpa-gu, Seoul | 8.72 |
| 9 | Yeongdeungpo-gu, Seoul | 8.55 |
| 10 | Jung-gu, Daegu | 8.55 |
| 11 | Gangneung-si, Gangwon State | 8.50 |
| 12 | Hongcheon-gun, Gangwon State | 8.46 |
| 13 | Chuncheon-si, Gangwon State | 8.45 |
| 14 | Gyeryong-si, Chungcheongnam-do | 8.45 |
| 15 | Gangnam-gu, Seoul | 8.44 |
| 16 | Hampyeong-gun, Jeollanam-do | 8.44 |
| 17 | Gwonseon-gu, Suwon-si, Gyeonggi Province | 8.39 |
| 18 | Seocho-gu, Seoul | 8.39 |
| 19 | Dong-gu, Daegu | 8.38 |
| 20 | Uiwang-si, Gyeonggi Province | 8.31 |
2nd- and 3rd-Tier Cities: A Map of Growth Potential
The 2nd and 3rd Tiers also carry important strategic implications. The 2nd Tier, comprising cities ranked from 51st to 100th, includes Uijeongbu; Dalseo-gu, Daegu; Gwanak-gu, Seoul; Mokpo; Saha-gu, Busan; Ulju-gun, Ulsan; Suncheon; Danyang-gun; Gochang-gun; Muju-gun; Namhae-gun; Donghae; Gunsan; and Icheon. These cities have already established a certain level of Reputation and Attractiveness. However, to advance into the 1st Tier, they need to sharpen their signature associations, develop longer-stay tourism products, refine their tourism portfolios, and strengthen targeted marketing.
The 3rd Tier, comprising cities ranked from 101st to 150th, includes Namwon; Danwon-gu, Ansan; Andong; Cheongsong-gun; Hampyeong-gun; Buyeo-gun; Imsil-gun; Jinan-gun; Naju; Guri; Yeongju; Boeun-gun; and Seosan. Among these, Hampyeong-gun; Gwonseon-gu, Suwon; Byeongjeom-gu, Hwaseong; Imsil-gun; and Seobuk-gu, Cheonan recorded relatively high Attractiveness scores, indicating substantial growth potential if they can improve their Reputation.
The 2nd and 3rd Tiers should therefore not be regarded simply as the middle or lower ranks. Rather, they should be understood as a map of future growth potential. While the 1st Tier identifies the cities that are currently leading, the 2nd and 3rd Tiers reveal cities that could make significant advances depending on the strategies they pursue. Tourism policy should not be limited to recognizing cities that already perform well. It should also identify what cities with strong growth potential need to improve in order to move forward.
Overall Interpretation: Korean tourism cities are evolving in three directions
Taken together, the results indicate that the competitiveness of Korean tourism cities is evolving along three broad trajectories.
First, the tourism competitiveness of the Seoul metropolitan area and major cities remains strong.
Seoul and Gyeonggi Province demonstrate high levels of competitiveness based on their large populations, accessibility, consumer markets, mixed-use cultural facilities, and lifestyle-oriented commercial districts. Seoul, in particular, functions as a platform city in which tourism-related discourse is generated and widely disseminated.
Second, nature- and leisure-oriented destinations continue to possess strong competitive advantages.
Cities in Gangwon State, Jeju, and parts of Gyeonggi, Chungcheong, and the Jeolla regions received high evaluations based on their natural landscapes and leisure resources. Natural assets alone, however, are not sufficient. To sustain competitiveness, destinations must integrate these resources with experiential activities, gastronomy, accommodation, and nighttime content.
Third, urban lifestyles and experience-oriented content are emerging as new sources of competitiveness.
Seongdong-gu, Yeongdeungpo-gu, Jung-gu in Daegu, and Dongtan-gu illustrate how everyday leisure spaces, street culture, cafés, shopping, parks, and waterfront areas can be transformed into tourism experiences beyond the conventional boundaries of tourist attractions. This suggests that local governments should approach tourism not as the development of individual attractions, but as the design of integrated visitor experiences.
Ultimately, the most important message emerging from the 2026 Korea Tourism City Competitiveness Assessment is clear. Tourism city competitiveness is no longer determined solely by the number of tourism resources or the scale of facilities. Accessibility brings visitors to a city, resources create reasons to visit, and experiences make the city memorable. To strengthen their future competitiveness, Korean tourism cities must integrate these three elements into a coherent strategy. YCCI serves as a data-driven compass that diagnoses how effectively these elements are connected and identifies what each city must do to advance to the next stage.
The policy significance of YCCI lies not in the rankings themselves, but in its ability to provide a basis for developing city-specific strategies to enhance competitiveness. In particular, by comparing their performance with that of other cities, destinations can identify their relative positions and use the results as a foundation for more rational and evidence-based policymaking.
The competitiveness of a tourism city cannot be strengthened through a single project or a short-term event. Sustainable competitiveness emerges only when a range of strategic initiatives are organically integrated and put into practice. These include developing an accurate understanding of existing and potential visitors, building distinctive brand assets rooted in local characteristics, optimizing the portfolio of tourism attractions and products, improving promotional efficiency, strengthening transportation and information infrastructure, and establishing an effective governance system.
YCCI therefore goes beyond simply showing “which city ranks where.” It can serve as a strategic tool that helps each city determine what it should strengthen, what it should adjust, and in which direction it should grow.
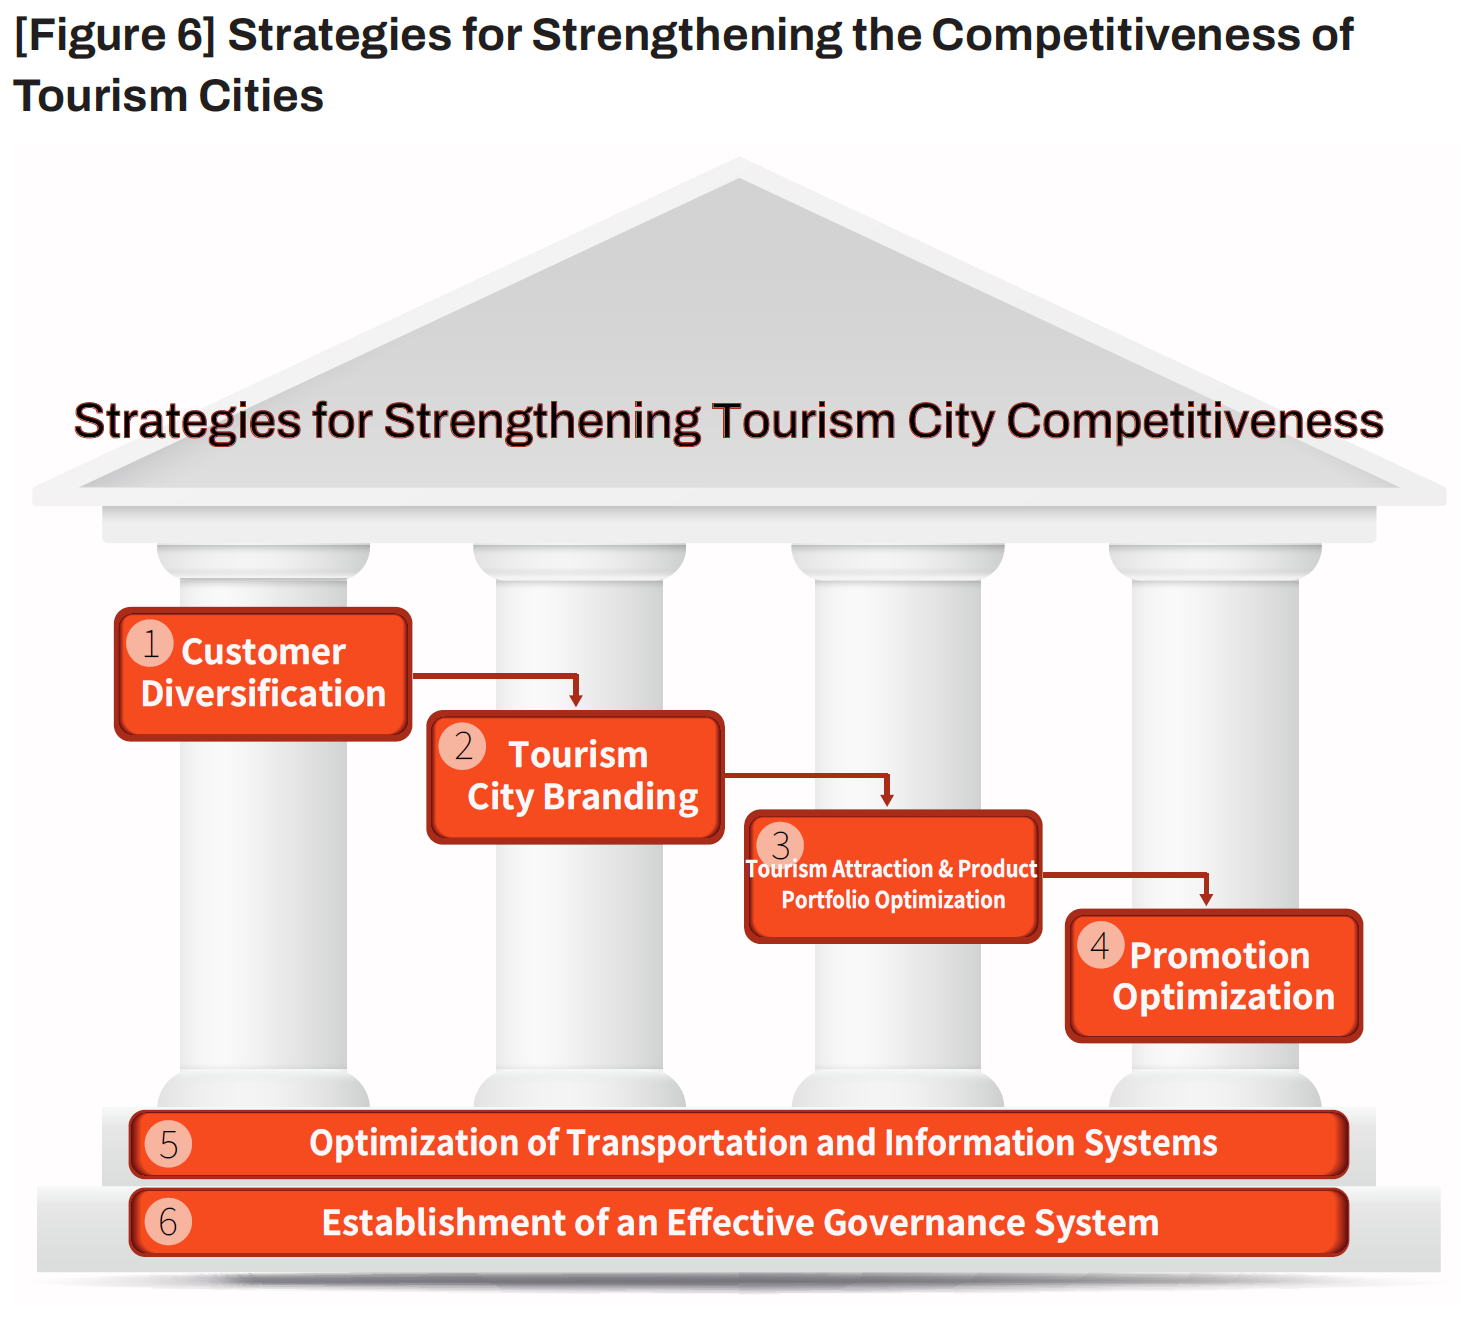
1. Customer Diversification: “Who are the visitors most likely to choose our city?”
First, tourism cities need to diversify their customer base from a multidimensional perspective. Tourism strategies in many regions are still rooted in the supply-oriented assumption that attracting as many visitors as possible is inherently desirable. However, a strategy designed to satisfy every type of tourist may ultimately fail to deliver a clear and compelling value proposition to any particular group.
Tourism cities should first segment existing and potential visitors according to demographic characteristics, travel behavior, purpose of travel, spending patterns, and psychological needs. They should then compare the visitor segments they currently attract with potential segments they have not yet reached effectively and identify target customers based on their compatibility with local content, likelihood of visitation, spending potential, and acceptance by the local community.
Most Korean tourism cities face structural vulnerabilities: they tend to have relatively narrow visitor bases, are highly affected by seasonality, and often lack clear positioning grounded in well-defined target segments. Overcoming these limitations requires cities to attract multiple layers of visitors suited to their local characteristics and establish an effective system for delivering the value those visitors seek.
2. Tourism City Branding: “What comes to mind when people hear the city’s name?”
Second, tourism cities need to strengthen their branding. Many tourism destinations in Korea actively promote individual tourism content, yet often lack a coherent brand message that unifies the destination as a whole. Rather than simply promoting individual attractions or tourism products, cities must build destination brands rooted in their distinctive local characteristics and visitor experiences. In other words, they need to strengthen city brand equity by establishing a clear brand identity and fostering strong core brand associations. Sustainable brand equity can be built only when the system linking identity, core associations, and value delivery operates effectively.
Yangyang provides a recent example. By combining its distinctive coastal resources with surfing as a tourism product, the city developed strong core associations and greater brand awareness, ultimately building powerful city brand equity. Gangneung’s association with coffee and Daejeon’s reputation as a destination for bakery tourism offer similar examples. Tourism cities should also make active use of diverse brand-leveraging strategies to build brand equity. Nami Island’s association with television dramas, Gangneung’s BTS Bus Stop, and Gyeongju’s role as a host city for APEC illustrate different forms of brand leverage that can effectively increase destination awareness and intention to visit.
Such branding strategies should begin by identifying candidate keywords based on buzz volume, search volume, frequently occurring terms in reviews, and social media responses. These keywords should then be refined according to four criteria: relevance, distinctiveness, sustainability, and experiential value. Once the core brand keywords have been established, slogans, tourism products, festivals, spatial design, and media exposure should all be designed to reinforce them consistently.
A brand is not merely an advertising phrase; it is the way tourists remember a city. Effective tourism city branding should therefore begin not with the question, “What should we promote?” but rather, “What do we want to be remembered for?”
3. Optimization of Tourism Attraction and Product Portfolios: “What should be expanded, developed, or phased out?”
Third, tourism cities need to optimize the portfolios of tourism attractions and products they currently possess and those they need to develop in the future. Many destinations face overlapping functions among tourism assets, the continued neglect of underperforming assets, and weak linkages between flagship attractions and complementary tourism hubs. To enhance tourism city competitiveness, cities must move beyond simply listing their tourism assets and systematically assess the role and performance of each one.
To this end, local tourism assets should first be inventoried and evaluated according to their structure, positioning, performance, and asset value. They should then be managed under three strategic categories: (1) Revitalization, (2) Rationalization, and (3) New Development.
Assets that remain well known but have become outdated should be revitalized through experiential content and rebranding. By contrast, assets that generate limited demand and economic impact should be considered for integration, conversion, or, where necessary, discontinuation.
New tourism attractions and products should be developed by identifying new forms of content and places that reflect changes in local demand, tourism trends, and policy directions, thereby generating new tourism demand. Such developments may be broadly categorized as nature-based, cultural and historical, or entertainment-oriented. Ideally, they should function as substitutes for or complement existing tourism attractions and products while reinforcing the distinctive strengths of the destination.
4. Promotion Optimization: “Awareness building and conversion must be treated differently”
Fourth, tourism cities need to improve the efficiency of their promotional activities. Promotion can be broadly divided into advertising and publicity and sales promotion. Advertising and publicity are designed to communicate a city’s image and information and generate interest, whereas sales promotion is intended to induce actual visits, bookings, and spending. Unless these two functions are clearly distinguished, substantial promotional expenditures may fail to translate smoothly into actual tourism demand and consumption.
From the perspective of YCCI, cities with high Attractiveness but low Reputation are likely to benefit from strategies such as user-generated content (UGC)-based viral marketing, listings on global online travel agencies (OTAs), influencer collaborations, and search and social media optimization. Such cities need to amplify the positive experiences of previous visitors and communicate them to a broader audience.
By contrast, cities with high Reputation but low Attractiveness should prioritize improvements in the on-site visitor experience—including service quality, visitor circulation, price transparency, and congestion management—rather than simply increasing promotional exposure. Advertising and publicity that are not supported by a positive visitor experience may instead widen the gap between expectations and reality and ultimately intensify visitor disappointment. Tourism cities should therefore make efficient use of an appropriate mix of promotional channels, including traditional media, digital media, and official websites.
Sales promotion at the regional level can be designed in several forms: (1) mobility-linked programs, (2) financial incentives, (3) initiatives tailored to specific target segments, and (4) integrated package products. Examples include transportation passes, travel subsidies, digital tourism resident cards, and bundled products combining tourist attractions, transportation, and accommodation.
The key, however, is to ensure that these promotional initiatives do not end as one-off discounts. They should be linked to the city’s broader brand strategy, visitor routes, and efforts to expand opportunities for tourism spending.
5. Optimization of Transportation and Information Systems: “The visitor journey must remain seamless”
Fifth, transportation and information systems need to be optimized with a focus on ease of mobility. The core of tourism transportation infrastructure lies not simply in the availability of transportation facilities, but in connectivity. A tourist’s overall journey consists of entering the city, traveling among major attractions within the destination, and moving across a wider region to neighboring cities. Major transportation arteries such as KTX rail services, airports, and expressways are not sufficient on their own. The last mile—the capillary network of tourism that connects stations, terminals, and accommodations with actual tourist attractions—must also function effectively.
To achieve this, improvements are needed in demand-responsive transport (DRT), Mobility as a Service (MaaS), tourism shuttle services, integrated transportation passes, multilingual maps, and reservation and payment systems. These elements are not merely convenience services; they are essential infrastructure for increasing the conversion of tourism demand into actual spending. Accessibility is particularly important for international visitors across services such as identity verification, digital maps, payments, food delivery, taxi-hailing, and reservations. When visitors experience difficulties finding their way, traveling, making reservations, or completing payments, even outstanding tourism resources cannot be fully accessed or consumed.
The Korean government has recently been promoting the development of inbound tourism regions. One of the major policies at the center of this initiative is the revitalization of regional airports to generate international tourism demand. If Korea reaches 30 million international visitors within the next three to four years, a wide range of regional cities will need to accelerate the development of transportation and information systems capable of accommodating this growing demand.
6. Establishment of an Effective Governance System: “Who Will Implement and Manage the Strategy over the Long Term?”
Sixth, tourism cities need to establish effective governance systems. Tourism-related decision-making by local governments is often vulnerable to a lack of continuity because of political cycles, staff rotation, organizational silos, and conflicts among stakeholders. Moreover, tourist movement is not confined by administrative boundaries. Visitors commonly stay in one city, visit attractions in another, and dine in yet another area. A fragmented approach centered on individual local governments therefore has clear limitations in strengthening tourism competitiveness.
To address this challenge, professional control towers and local and regional Destination Management Organizations (DMOs) should connect strategic planning, product development, marketing, and performance management. Cooperation based on a Hub-and-Spoke structure is also needed at the regional level. Hub cities such as Seoul and Busan should attract large numbers of international visitors and help disperse this demand to surrounding spoke cities. Spoke cities, meanwhile, should expand their international visitor base through transportation services, tourism products, and promotional initiatives linked to major hubs, while also maintaining a stable domestic tourism market.
The core questions of governance are: “Who will implement the strategy?” and “How will performance be managed?” Tourism policy should therefore be designed not simply as a collection of individual projects, but as a long-term operating system incorporating performance-based key performance indicators (KPIs), data monitoring, public–private collaboration, and interregional coordination. In particular, KPIs should be specified in measurable terms—including economic indicators, tourism indicators, locally specialized indicators, and other relevant metrics—and managed continuously through regular monitoring and evaluation.
Table 9. Implementation Directions for the Six Competitiveness-Enhancement Strategies
| Strategy | Core Question | Key Action Areas |
|---|---|---|
| Customer Diversification | Who are the visitors most likely to choose our city? | Market segmentation, target selection, value proposition development, and differentiated customer strategies for hub and spoke destinations |
| Tourism City Branding | What comes to mind when people hear the city’s name? | Identification of brand keywords, refinement of core associations, and consistent design of messages, products, and spaces |
| Tourism Attraction and Product Portfolio Optimization | Which tourism assets should be expanded, developed, or phased out? | Revitalization, rationalization, new development, and conversion into longer-stay tourism products |
| Promotion Optimization | Which promotional tools can generate actual visits and spending? | Differentiation between advertising/publicity and sales promotion, UGC, package products, and transportation–accommodation linkages |
| Optimization of Transportation and Information Systems | How can the visitor journey be connected more effectively? | Gateway accessibility, last-mile mobility, interregional connectivity, and improvements in multilingual information, payment, and reservation systems |
| Establishment of an Effective Governance System | Who will implement the strategy over the long term and manage its performance? | Professional control towers, DMOs, interregional collaboration, and performance-based KPIs |
The most important implication of YCCI for tourism policy is that the basis of tourism policymaking should shift from supplier-oriented inputs to visitor-oriented experiences. Many local governments have traditionally explained tourism performance in terms of what they built, which festivals they organized, and how much budget they executed. Tourists, however, do not consume government inputs themselves. They consume the places, food, products, prices, people, mobility, atmosphere, landscapes, experiences, and memories they encounter during their trips. Tourism city competitiveness should therefore be evaluated not by administrative outputs, but by the outcomes reflected in visitor experiences.
Policy Implications
The first policy implication is the need to redesign tourism performance management systems. Visitor numbers, festival attendance, and promotional reach are no longer sufficient as the sole KPIs for tourism policy. Even when a destination attracts large numbers of visitors, its economic impact on the local community may remain limited if visitors stay only briefly, spend little, and show low intentions to return. Conversely, a destination with relatively fewer visitors may possess healthier tourism competitiveness if visitors stay longer, spend more in local commercial districts, and generate a high volume of positive reviews.
Tourism policy performance should therefore be managed through a multidimensional set of indicators.
Table 10. Key Indicators for Tourism Performance Management
| Performance Area | Key Indicators |
|---|---|
| Visitation Performance | Number of visitors, repeat visitation rate, share of first-time visitors, and cross-destination visitation |
| Spending Performance | Tourism expenditure, diffusion of spending across local commercial districts and growth rate, and accommodation conversion rate |
| Length-of-Stay Performance | Time spent in the destination, number of overnight stays, and mobility across the broader tourism region |
| Experience Performance | Positive sentiment ratio, intention to recommend, intention to revisit, and mentions of visitor inconvenience |
| Infrastructure Performance | Last-mile transportation convenience, multilingual information, and ease of reservation and payment |
Among these dimensions, YCCI provides indicators that specifically capture tourists’ perceptions and emotional responses. When combined with credit card transaction data, mobile network data, accommodation reservations, transportation data, festival admission records, and OTA review data, YCCI can support the development of a more sophisticated regional tourism performance management system. In this sense, YCCI shifts the evaluation of tourism policy away from the question of “How much was done?” toward “What outcomes did those efforts produce for visitors?”
The second implication concerns more targeted and precise budget allocation. Not every region needs to construct new large-scale tourism facilities. Because the structure of competitiveness differs across destinations, budget priorities should also vary. By examining the combination of Reputation and Attractiveness, YCCI identifies the types of challenges faced by individual cities.
For example, destinations with high Attractiveness but low Reputation are already providing positive visitor experiences. For these cities, allocating budgets to content distribution, branding, transportation connectivity, and access to booking and sales channels may be more effective than investing in large-scale new facilities. By contrast, destinations with high Reputation but low Attractiveness should invest less in additional promotion and more in congestion management, restoration of price confidence, convenience infrastructure, service training, improvements in public information, and the development of nighttime content. Destinations with low scores in both Reputation and Attractiveness require longer-term initiatives, such as reinterpreting existing assets or identifying new anchor content.
Indicators should therefore not serve as tools for encouraging greater expenditure. Rather, they should help determine where public resources should be allocated. In tourism policy, the direction of investment is more important than the absolute scale of spending.
2. Turning local brand equity into data: Using the language of tourists, not administrators
The third implication is the need to transform local brand equity into measurable data. A city brand does not exist in administrative documents; it exists in the perceptions of the market. When a slogan created by a local government does not align with the language used by tourists, the brand is unlikely to function effectively. For example, a city may describe itself as a “dynamic cultural city,” but if tourists remember it through associations such as “coffee,” “the sea,” “night views,” “traditional markets,” or “bakery tours,” its branding strategy should be realigned around the language of visitors.
Brand keywords should therefore not be determined solely through internal administrative discussions. Cities should examine search volume, social media mentions, frequently occurring words in reviews, visitor feedback, and comparisons with competing destinations to understand which terms tourists already associate with the city. Among these existing associations, destinations should identify and reinforce those that are both sustainable and distinctive.
Branding is not primarily a process of creating an image and imposing it on the market. Rather, it is closer to identifying existing seeds of perception and nurturing them. YCCI can provide baseline data for tracking each city’s core associations and emotional responses and can support the measurement of broader brand equity encompassing awareness, image, associations, perceived quality, and loyalty.
3. Integrating inbound and intrabound tourism: Domestic travelers must also be reconsidered
The fourth implication is the need for an integrated approach to inbound and intrabound tourism. The challenge facing Korean tourism is not limited to attracting more international visitors. The fact that Korean residents may choose overseas destinations instead of domestic tourism cities can also be interpreted as a signal of insufficient competitiveness within the domestic tourism market. When domestic travelers do not perceive novelty, price reliability, convenient mobility, quality accommodation, or appealing content in domestic destinations, international visitors may encounter similar limitations.
Domestic and international visitors naturally have different needs. Nevertheless, the fundamental structure of a positive tourism experience is broadly similar. Destinations must be easy to access and understand, reservations and payments must be convenient, and the content must be memorable.
Tourism development should therefore begin with shared local assets while differentiating language services, payment systems, visitor routes, reservations, information, and product packaging according to the needs of each market. In other words, destinations need strategies that transform a common set of resources into differentiated customer experiences.
Industry Implications: A common language for public–private collaboration
The primary industry implication is the need for stronger public–private collaboration. The public sector manages local resources, institutions, infrastructure, and long-term planning. Private platforms and businesses, by contrast, possess customer data, booking and sales channels, real-time indicators of demand, and global distribution networks.
Tourists do not distinguish between the public and private sectors; they experience the entire journey as a single, integrated process. Traveling from an airport to a city, booking accommodation, finding restaurants, using transportation, purchasing experiential products, and leaving reviews are all components of one tourism experience.
An effective governance system is therefore needed in which local governments, tourism organizations, DMOs, OTAs, accommodation, food and beverage, and transportation providers, cultural content companies, MICE organizers, and local community organizations jointly interpret data and translate insights into action.
YCCI can serve as a common language for this collaboration. Local governments can use YCCI to assess a city’s levels of Reputation and Attractiveness, while private platforms can use booking, search, and review data to measure actual purchase conversion. When these data sources are integrated, tourism policy can evolve from a promotion-centered approach toward one focused on demand creation and the conversion of tourism interest into actual consumption.
Academic Implications: Expanding the study of tourism city competitiveness
YCCI also carries important academic implications. Research on tourism destination competitiveness has long focused on resources, infrastructure, management capabilities, policy environments, and price competitiveness. YCCI adds a new dimension to this body of research by incorporating demand-side sentiment derived from social big data. It therefore represents an attempt to connect Destination Image Theory, Tourism Motivation Theory, the Resource-Based View, and Brand Equity Theory with real-world digital data.
In particular, YCCI reframes tourism city competitiveness as more than the volume of resources a destination possesses. Instead, it examines how those resources are interpreted and diffused through tourists’ perceptions and emotions. Resources constitute supply-side conditions, but they become genuine sources of competitiveness only when they are transformed into positive visitor experiences and online discourse. YCCI represents an effort to capture this transformation through large-scale social data.
Social data also have limitations. Potential concerns include digital-user bias, age-, language-, and platform-related biases, the possible overrepresentation of event-driven buzz, and the coexistence of comments from actual visitors and non-visitors. YCCI should therefore not be used as a stand-alone absolute measure. Its explanatory power becomes stronger when combined with survey, mobility, spending, accommodation, transportation, and visitor complaint data.
Nevertheless, YCCI represents an important innovation because it addresses gaps in existing indicators by capturing large-scale voluntary mentions and emotional responses. Whereas conventional indicators primarily measure competitiveness from the supply side, YCCI reveals tourists’ perceptions and experiences from the demand side. A more balanced understanding of tourism city competitiveness becomes possible when these two perspectives are integrated.
The Yanolja City Competitiveness Index (YCCI) raises a new set of questions for advancing Korean tourism. It is no longer sufficient to focus solely on quantitative indicators such as how many tourists a city attracts. We must also ask what visitors experience, how long they stay, how much they spend, and whether they wish to return. As the essence of tourism evolves from simple “movement and sightseeing” toward the “consumption of experiences and memories,” the basis for evaluating city competitiveness must likewise shift from supplier-oriented input indicators to visitor-oriented outcome indicators.
The YCCI results reveal both the potential and the limitations of Korean tourism. The highest-ranking cities—including Songpa-gu, Suyeong-gu, Yeongdeungpo-gu, Seongdong-gu, Jung-gu in Daegu, Gyeongju, Seogwipo, Haeundae-gu, Gangneung, and Gangnam-gu—share one important characteristic: they do not merely possess tourism resources but have successfully transformed those resources into attractive experiences that visitors can meaningfully perceive and enjoy. At the same time, several structural bottlenecks remain to be addressed, including the concentration of tourism in the Seoul metropolitan area, Seoul-centered inbound travel patterns, regional disparities in tourism readiness, perceptions of high prices, standardized tourism content, and insufficient last-mile infrastructure.
Future tourism policies should therefore be tailored to each city’s competitive position. Cities with high Reputation should focus less on additional promotion and more on improving the quality of visitor experiences. Cities that provide compelling experiences but remain relatively unknown should prioritize strategies that improve discoverability. Cities with limited tourism resources should seek to identify and develop their own distinctive sense of place rather than imitating other destinations. Achieving these goals will require the coordinated operation of experiential content that encourages visitor participation, brands that encapsulate local identity, tourism product portfolios that promote longer stays, infrastructure that supports seamless mobility and payment, and public–private governance systems.
In an era of population decline, tourism is more than a supplementary response to regional depopulation. It is one of the most practical and important means of creating a new consuming population and restructuring local economies. When visitation, length of stay, mobility, spending, and positive memories are connected within a single system, tourism can move beyond its traditional role as a leisure industry and become a new engine of growth for Korea and a driving force for balanced regional development.
In this context, the true significance of YCCI does not lie in simply ranking cities. Rather, its value lies in serving as a strategic map that enables each city to use objective data to identify its strengths and weaknesses and determine the most appropriate path for future development. YCCI is expected to serve as a starting point for a shift toward visitor-centered competition based on experience and to help every tourism city in Korea evolve into a destination where visitors want to stay longer, return, and recommend.
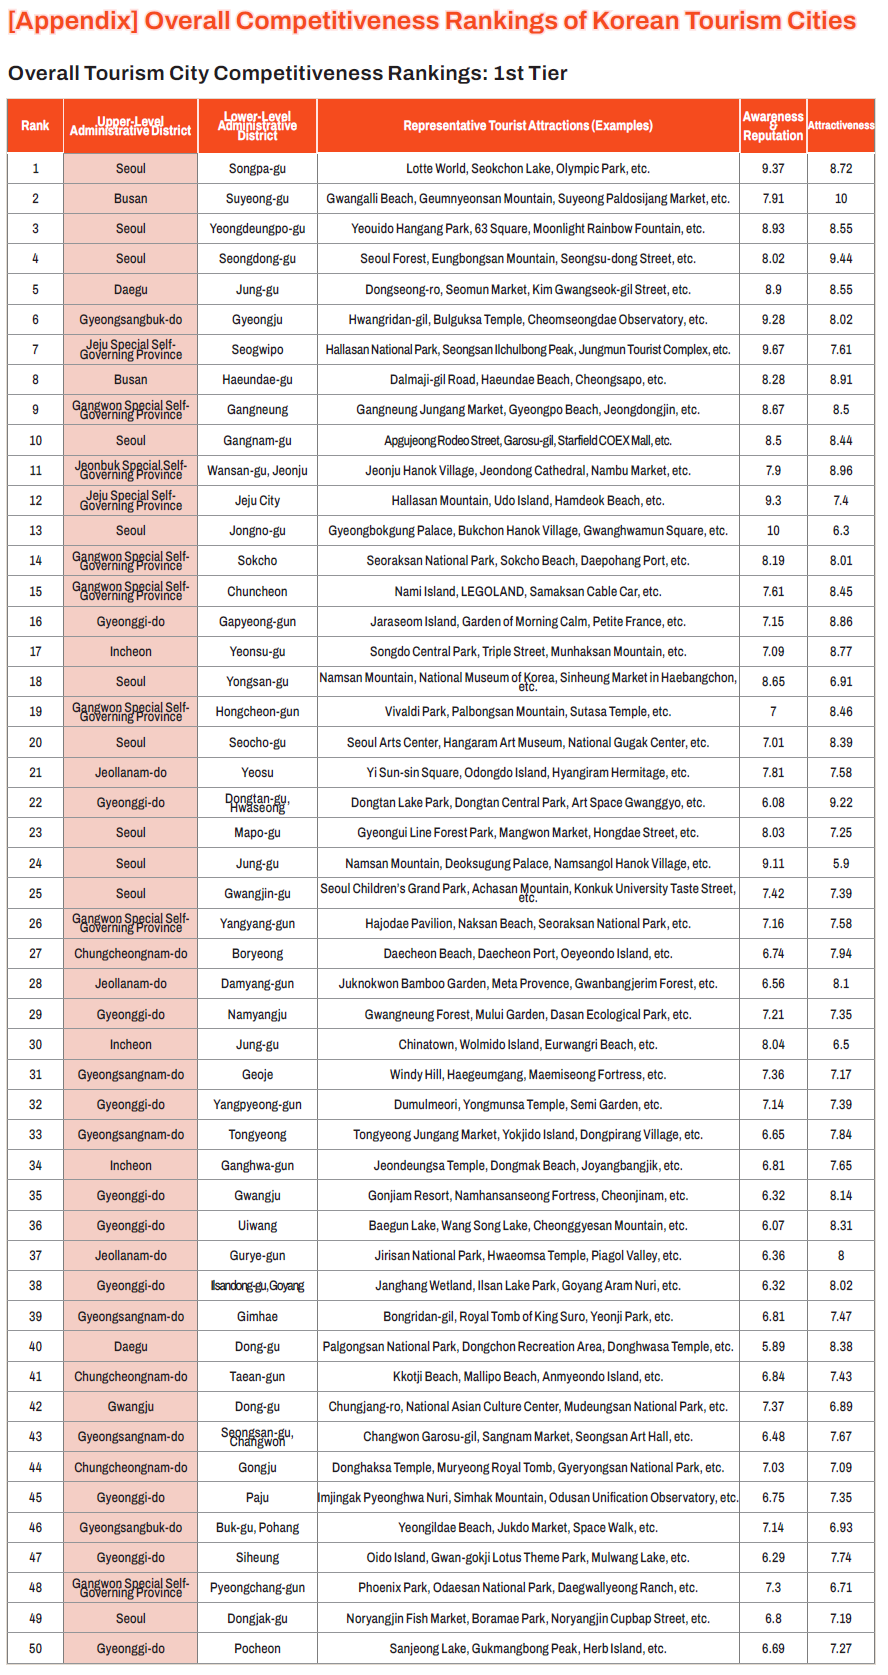
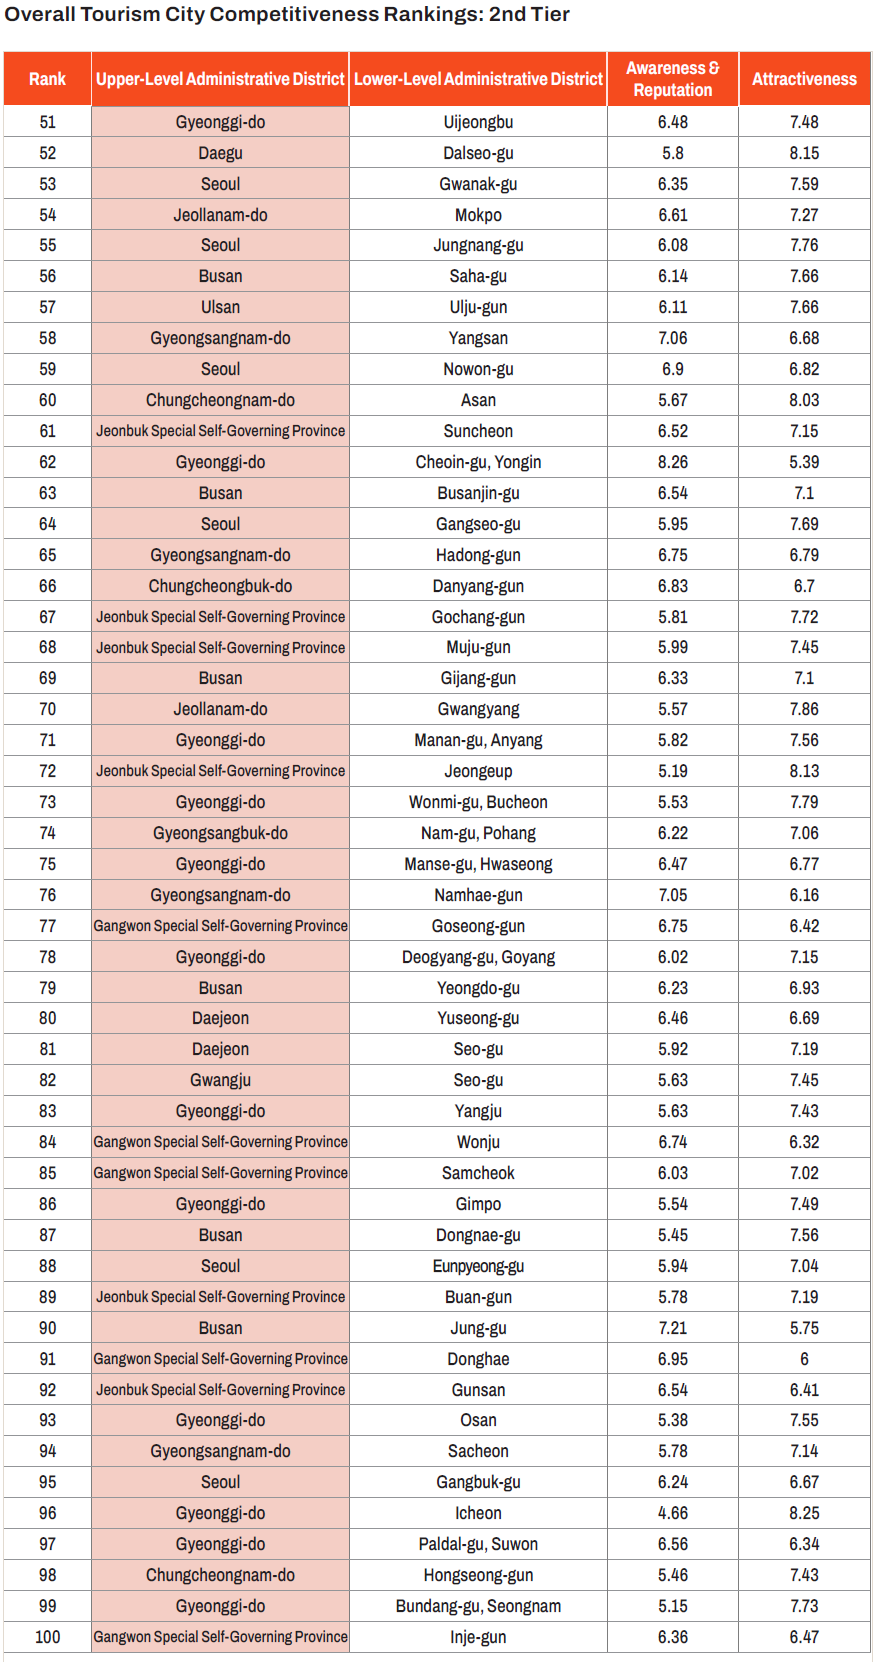
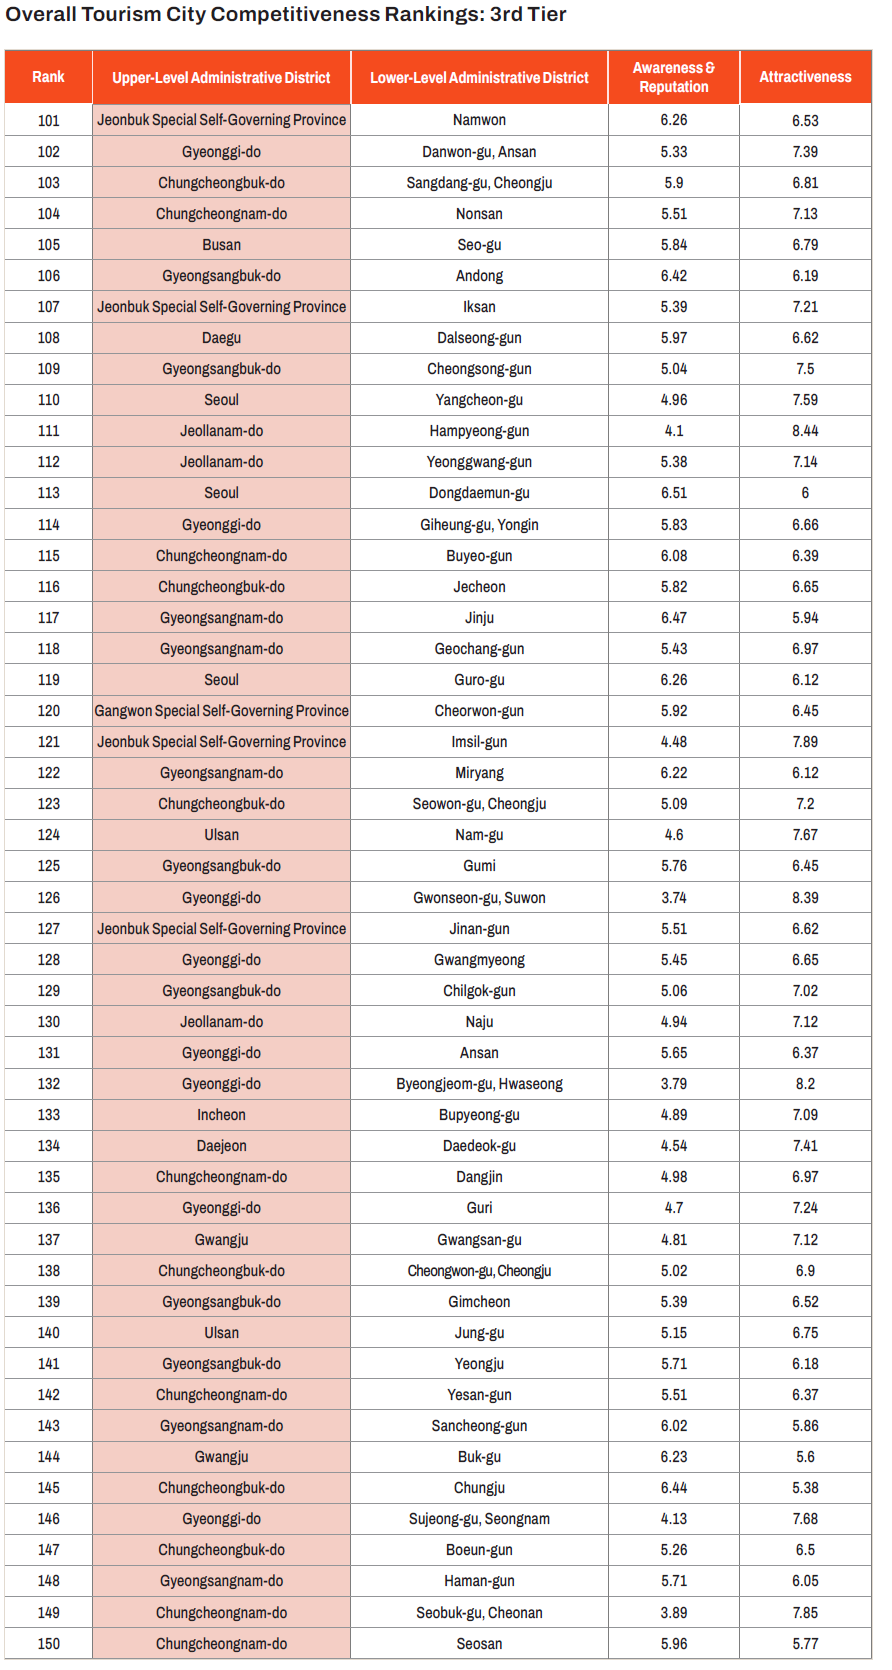
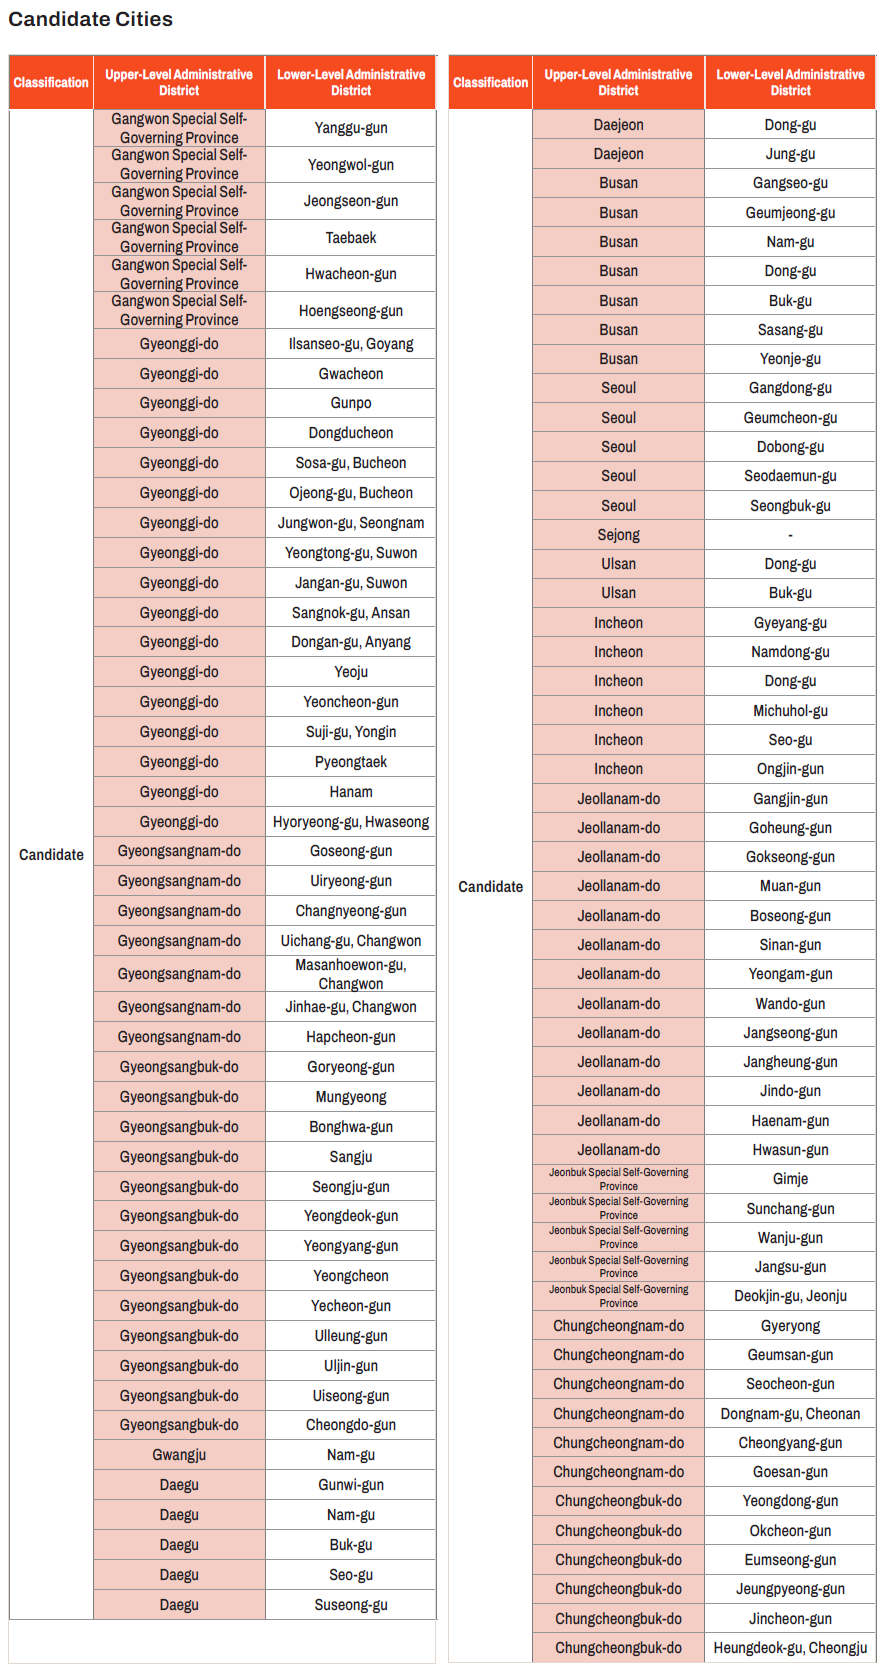
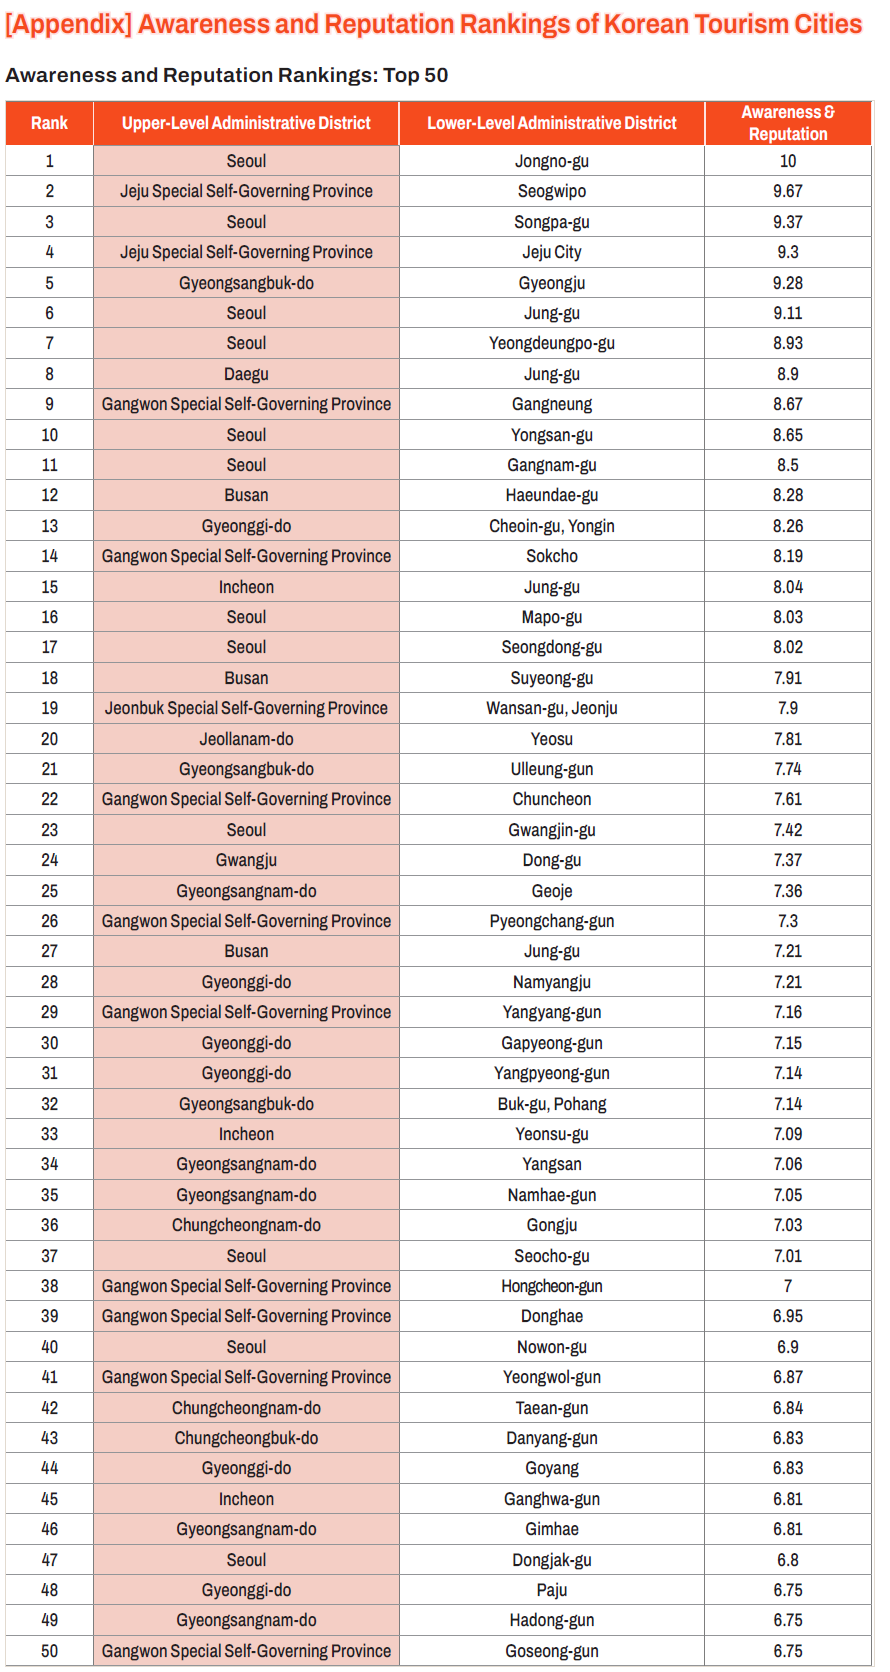
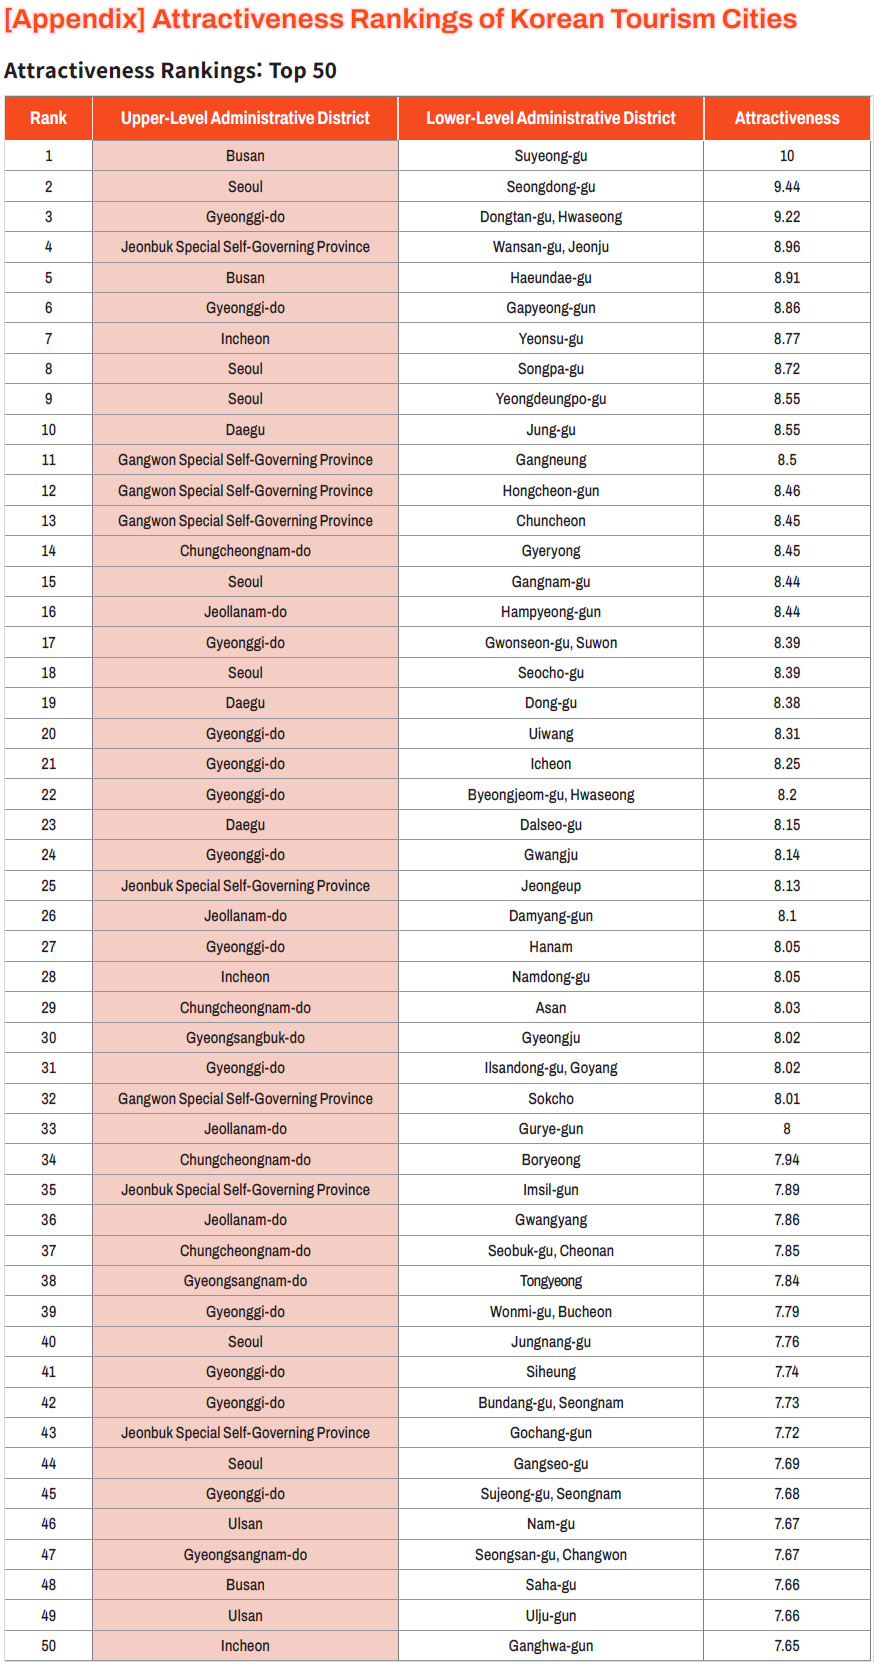
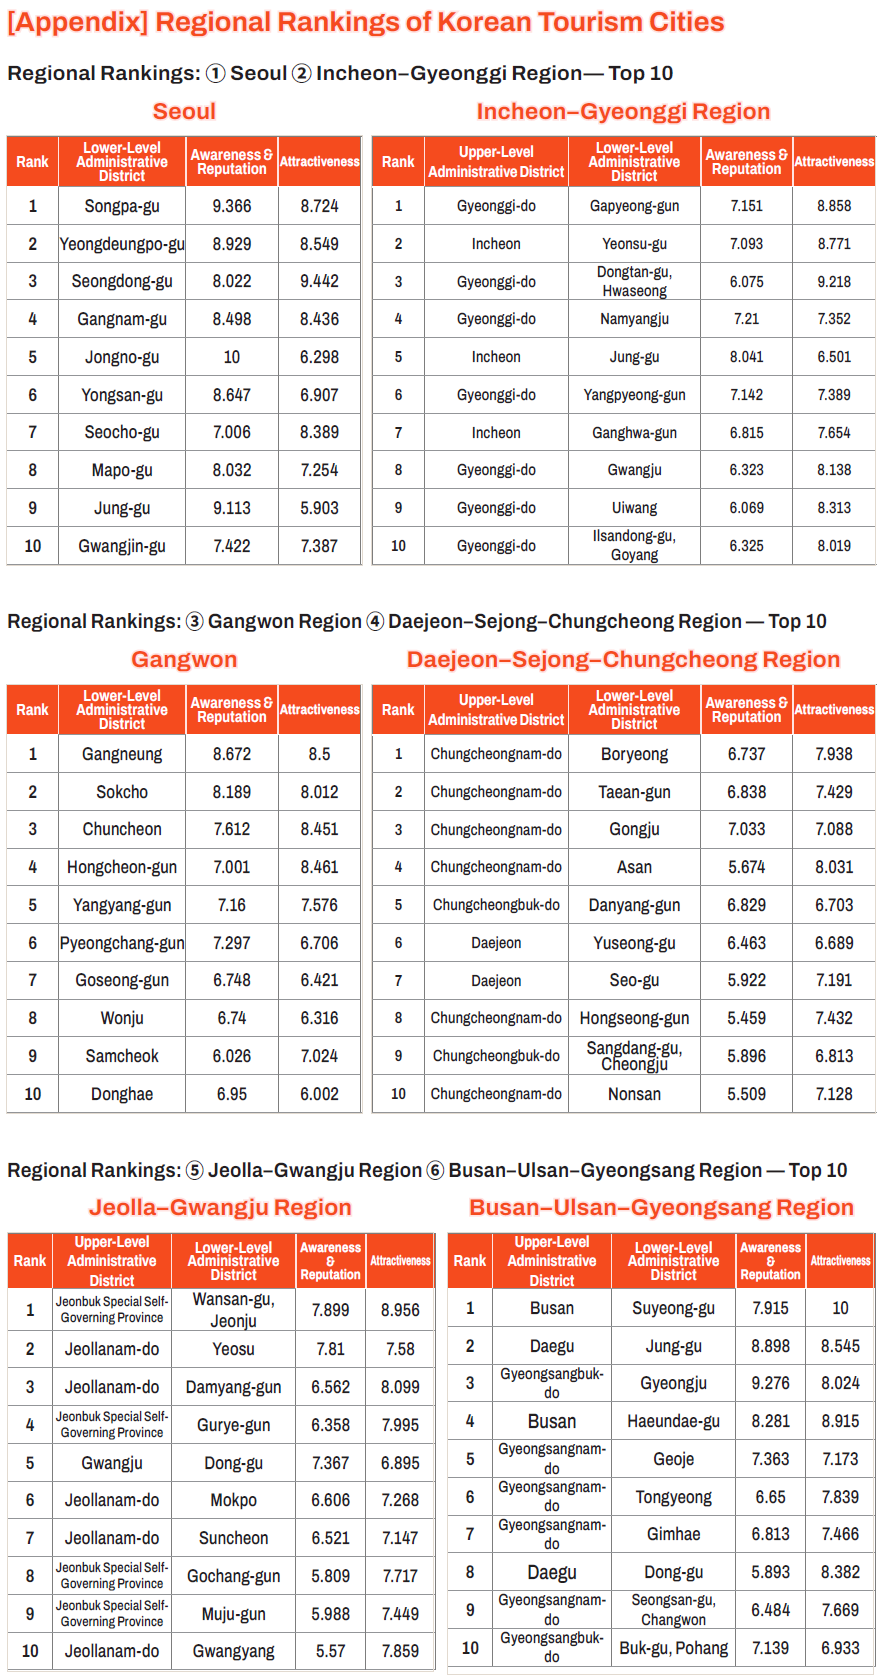
To reference this article, please use the following citation: “SooCheong Jang, Kyuwan Choi (2026). Yanolja City Competitiveness Index: A Compass for Assessing Tourism City Competitiveness, Yanolja Research Insights, Vol.44.”


 Prev
Prev  Back
Back