
Brief
Vol.14 Analysis of Korea's Inbound and Outbound Tourism Performance for H1 2026
- Reg Date
- 2026.08.06


Analysis of Korea's Inbound and Outbound Tourism Performance for H1 2026
Executive Summary
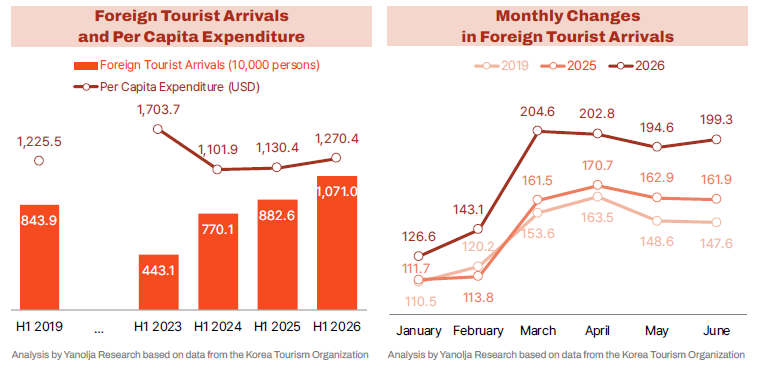
- Inbound Tourism: Foreign tourist arrivals reached 10.710 million in the first half of 2026, setting a record high for any half-year period (+21.3% YoY, +26.9% vs. 1H 2019). Bolstered by market diversification across origin countries and regions as well as the expansion of medical tourism, both total tourism receipts ($13.61 billion) and per capita expenditure ($1,270.40) surpassed 2019 levels.
- Outbound Tourism: Outbound Korean departures totaled 14.962 million, remaining slightly below pre-pandemic 2019 levels (-0.3%). Weighing on consumer sentiment, high exchange rates and elevated oil prices prompted outbound travel to turn downward for two consecutive months in May and June.
- Tourism Balance: While the cumulative balance for the first half recorded a deficit of $1.26 billion, the balance maintained a four-month winning streak in surplus after swinging into positive territory in March—its first monthly surplus in 11 years and 4 months. A weaker Korean won provided a tailwind for inbound tourism while serving as a headwind for outbound travel, driving a sharp recovery in the overall balance.
- Second-Half Outlook: Pushed by the strong momentum in H1, the tourism balance is projected to be well positioned for a potential shift into an annual surplus this year. Turning the annual balance positive remains within striking distance provided an average monthly surplus of $210 million or higher is sustained in the second half. However, key wildcards include the duration of KRW strengthening and the trajectory of per-visitor spending.d
Inbound Tourism Performance
Foreign Tourist Arrivals: H1 2026 Hits Record High for First-Half Period at 10.71 Million
- Foreign tourist arrivals to South Korea totaled 10.710 million in the first half of 2026, setting an all-time high for any first-half period. This represents an increase of 21.3% year-over-year and 26.9% compared to the same period in 2019, demonstrating a further expansion of an inbound market that had already surpassed 2019 levels in 2025. Despite rising global jet fuel prices and subsequent route detours and supply adjustments following the escalation of war between the US/Israel and Iran on February 28, inbound demand maintained its upward momentum. Monthly arrivals expanded from 1.26–1.43 million in January–February to 2.046 million in March, hovering steadily between 1.94 and 2.03 million per month from April through June.
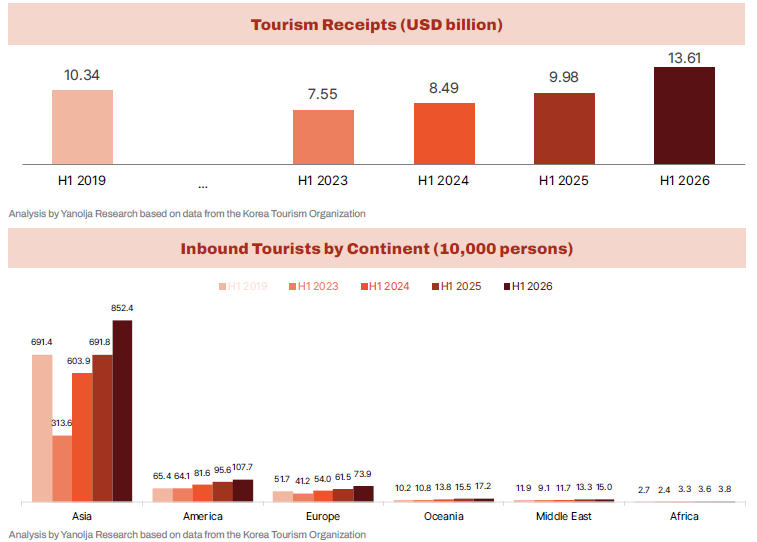
- Both Asian and non-Asian markets posted growth across the board. Arrivals from the Asian market reached 8.524 million (+23.2% YoY, +23.3% vs. H1 2019), fully recovering past pre-pandemic levels in volume. Non-Asian markets, which had already regained 2019 levels in H1 2025, continued to expand across all regions: the Americas posted 1.077 million (+12.7% YoY), Europe 739,000 (+20.2%), Oceania 172,000 (+11.4%), the Middle East 150,000 (+12.9%), and Africa 38,000 (+7.2%).
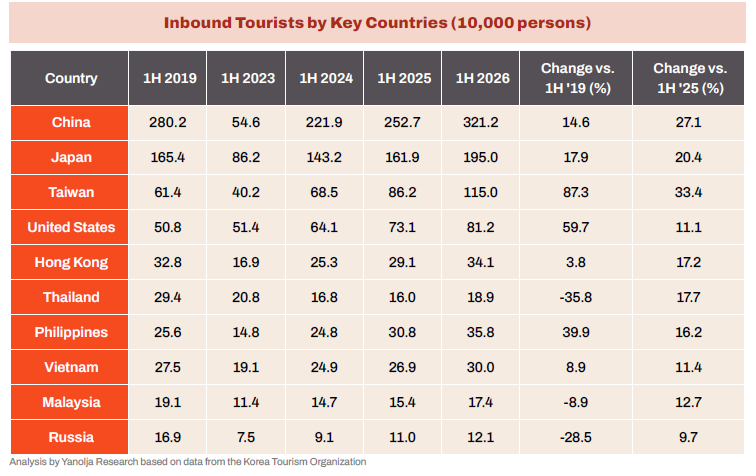
- By source country, China retained its position as the largest market with 3.212 million arrivals (+27.1% YoY), followed by Japan with 1.950 million (+20.4%). Both markets surpassed their H1 2019 figures for the first time on a first-half basis. Taiwan recorded the highest growth rate among the top 10 origin markets at 1.150 million arrivals (+33.4%). All top 10 source countries saw year-over-year increases, including the United States (812,000; +11.1%), the Philippines (358,000; +16.2%), and Hong Kong (341,000; +17.2%).
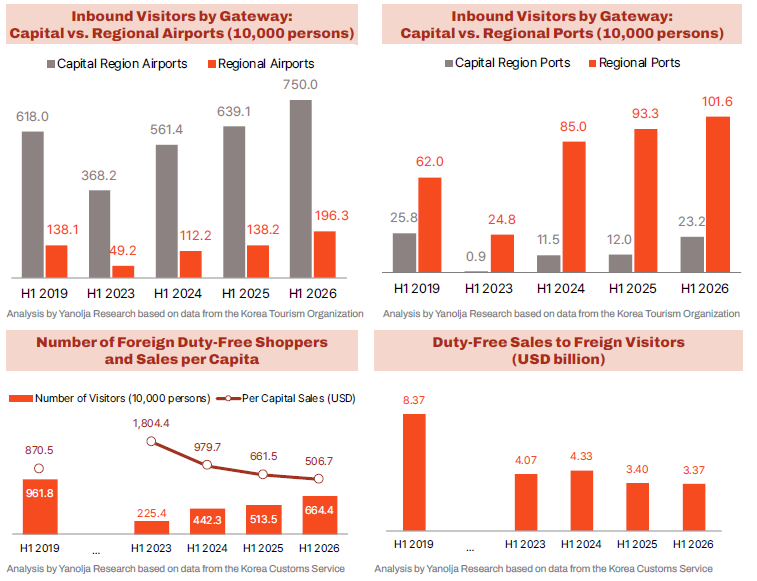
- Regarding entry gateways, regional non-capital entry hubs expanded noticeably. Foreign visitors entering through Metropolitan Area airports (Incheon and Gimpo) totaled 7.500 million in H1 2026, up 21.4% compared to H1 2019. In contrast, arrivals via regional airports (Gimhae, Daegu, Cheongju, Jeju, etc.) surged by 42.2% to 1.963 million. Arrivals through regional sea ports (Busan, Jeju, etc.) also jumped 63.8% compared to 2019 to reach 1.016 million, whereas sea port entries in the capital region fell 10.4% to 232,000. These shifts highlight that growing inbound demand is not confined to capital airports but is increasingly dispersing into regional airports and sea ports.
Tourism Receipts: Both Total Receipts and Per Capita Expenditure Exceed 2019 Levels
- Cumulative tourism receipts in the first half of 2026 reached $13.61 billion, up 31.6% compared to $10.34 billion in H1 2019 and 36.4% year-over-year. Per capita tourism receipts stood at $1,270.40, marking a 3.7% increase from 2019 and a 12.4% gain from the previous year. Consequently, in nominal USD terms, both total receipts and per capita spending surpassed pre-pandemic levels.
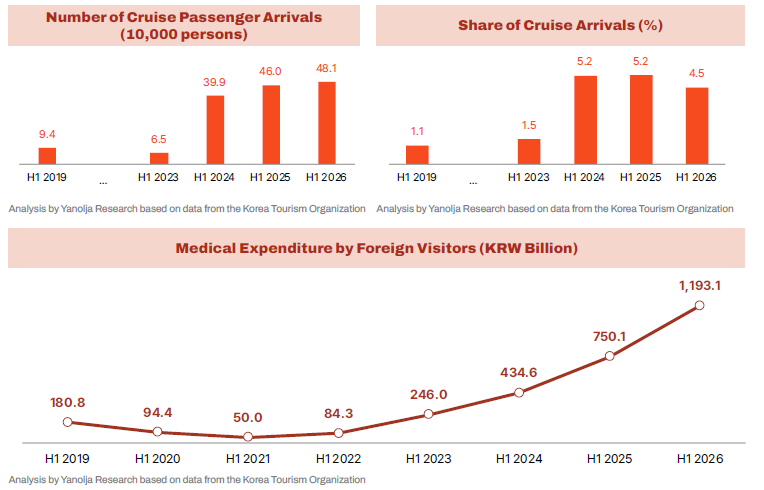
- The steep surge in medical expenditure by foreign visitors highlights the growth potential of high-value tourism. Foreign medical spending in H1 2026 reached approximately KRW 1.1931 trillion, representing a 6.6-fold increase compared to H1 2019 and a 59.1% growth year-over-year. Medical tourism—characterized by longer stays and higher spending—has established itself as a major new driver of high-value consumption, serving as a primary catalyst for boosting per capita spending.
- However, the duty-free sector continues to lag. The number of foreign duty-free shoppers dropped 30.9% from 9.618 million in 2019 to 6.644 million in 2026, while per capita duty-free sales fell 41.8% from $870.50 to $506.70. As a result, total duty-free sales to foreign visitors contracted 59.8%, down from $8.37 billion to $3.37 billion. Meanwhile, cruise arrivals—typically associated with shorter stays and lower spend—more than quadrupled compared to 2019 to reach 481,000 in H1 2026, exerting downward pressure on overall per capita spending by expanding the share of low-spending tourists.
Outbound Tourism Performance
Outbound Departures: H1 2026 Nears 2019 Levels at 14.962 Million
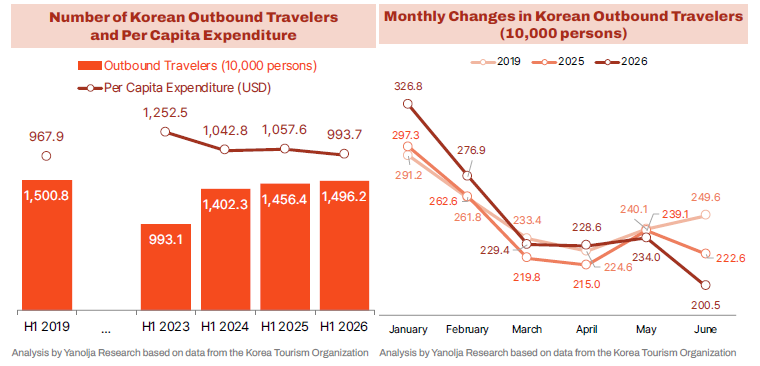
- Korean outbound travelers totaled 14.962 million in the first half of 2026, coming within close reach of pre-pandemic levels (-0.3% vs. H1 2019) without fully recovering. While outbound volume grew 2.7% year-over-year, monthly trends reversed into a decline for two consecutive months in May (-2.1%) and June (-10.0%) following steady YoY gains from January through April. This slowdown likely reflects a combination of rising global jet fuel prices since late February, international flight capacity adjustments, and elevated exchange rates.
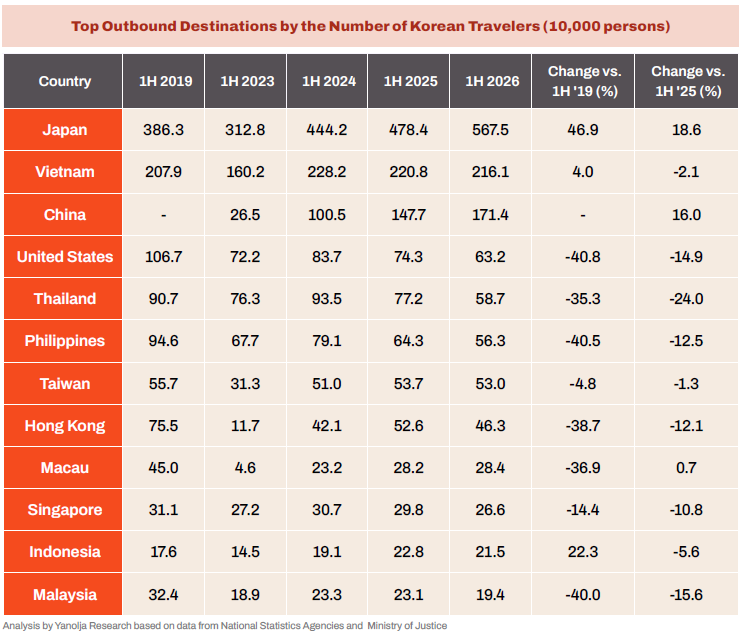
- By destination, the concentration of outbound travel to Japan became even more pronounced. Korean visitors to Japan surged to 5.675 million—up 46.9% compared to 2019 and 18.6% year-over-year—accounting for 37.9% of total outbound departures. This marks a 12.2 percentage point increase from 25.7% recorded in H1 2019. Departures to Vietnam reached 2.161 million, up 4.0% vs. 2019 but down 2.1% YoY, while travel to China grew 16.0% YoY to 1.714 million.
- In contrast, a majority of long-haul and Southeast Asian destinations remained well below 2019 levels, including the United States (632,000; -40.8% vs. 2019), Thailand (587,000; -35.3%), the Philippines (563,000; -40.5%), Hong Kong (463,000; -38.7%), Macao (284,000; -36.9%), and Malaysia (194,000; -40.0%). These figures demonstrate that despite total outbound travel nearing pre-pandemic levels, the recovery remains heavily concentrated in specific destinations, most notably Japan.
Tourism Expenditure: Slightly Exceed 2019 levels in USD, Decreases Year-Over-Year
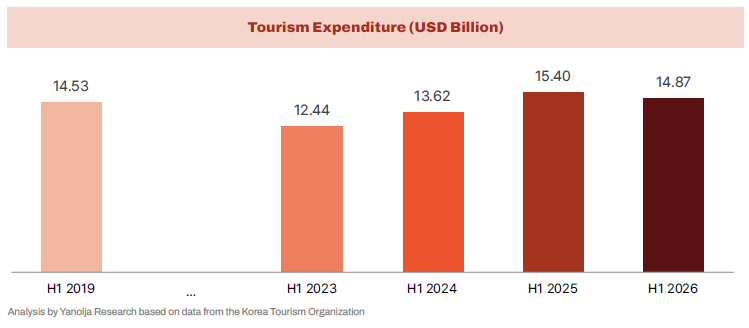
- Tourism expenditure stood at $14.87 billion in H1 2026, representing a 2.4% increase from H1 2019 ($14.53 billion) but a 3.5% decline year-over-year compared to H1 2025 ($15.40 billion). Per capita tourism expenditure was $993.70—2.7% higher than $967.90 in 2019, but down 6.0% from $1,057.60 in the previous year. Meanwhile, tourism expenditure converted into Korean Won using period-average exchange rates jumped 32.9% compared to 2019. This indicates that while spending growth in USD terms was limited, the financial burden felt by Korean travelers in local currency increased substantially due to high exchange rates.
Tourism Balance: Four-Month Winning Streak in Surplus—Will It Turn Positive Annually?
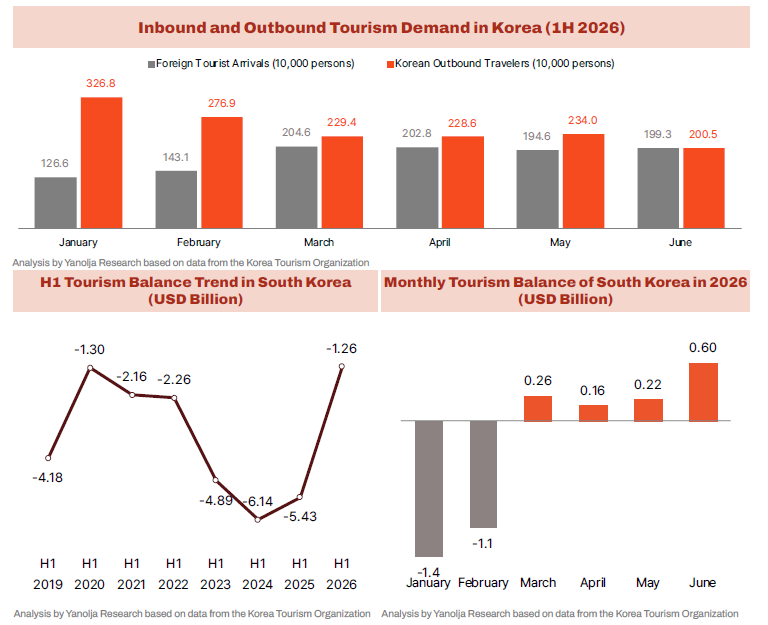
- In the first half of 2026, the South Korean tourism market saw inbound travel reach an all-time high for a first-half period, whereas outbound travel turned downward year-over-year in May and June. While Korean outbound travelers outnumbered foreign visitors by 2.6 times in January, the gap closed rapidly starting in March, bringing the two numbers virtually level by June.
- This shift translated directly into a sharp improvement in the tourism balance (travel balance of payments). Starting with deficits of -$1.40 billion in January and -$1.10 billion in February, the balance swung into a surplus of +$2.60 billion in March—marking the first monthly surplus in 11 years and 4 months. It subsequently maintained a four-month streak in positive territory with +$1.60 billion in April, +$2.20 billion in May, and +$6.00 billion in June. Although the cumulative H1 balance remained in a deficit of -$1.26 billion, the shortfall narrowed dramatically compared to -$4.18 billion in H1 2019 and -$5.43 billion in H1 2025.
- From an accounting standpoint, this improvement was driven by a 36.4% year-over-year surge in tourism receipts alongside a 3.5% decline in tourism expenditures. Inbound growth was fueled by simultaneous gains in tourist arrivals (+21.3%) and per capita receipts (+12.4%). Conversely, despite a 2.7% increase in total outbound travelers, overall expenditure dropped due to a 6.0% decrease in per capita outbound spending. In short, the H1 balance improvement resulted from a dual rise in inbound volume and spending unit price, combined with a drop in outbound spending unit price.
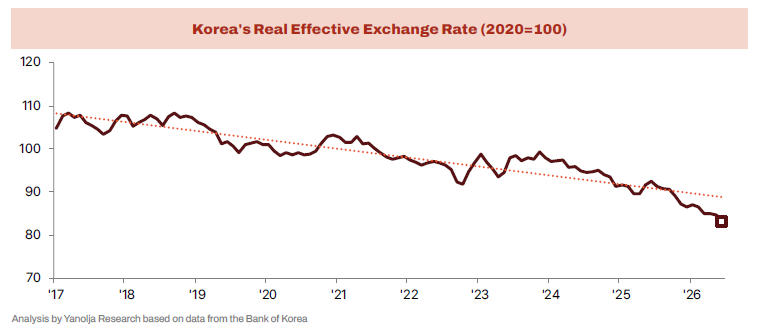
- Exchange rates serve as a primary underlying driver of these trends. Korea’s real effective exchange rate (REER) has shown a long-term downward trend, falling from 87.02 in January 2026 to 83.06 in June. The depreciation of the Korean won enhanced the price competitiveness of traveling to Korea for foreign tourists while increasing the financial burden of overseas travel for locals. Exchange rates are expected to remain a critical factor in H2. In July, the won strengthened due to the Bank of Korea's policy rate hike, improved foreign exchange supply/demand, and market stabilization measures. However, whether this appreciation will persist as a structural trend remains uncertain, as US monetary policy, the trajectory of the USD, semiconductor market dynamics, Middle East geopolitical tensions, and global capital flows will complexly influence exchange rates and travel demand.
- Strictly by the numbers, an annual shift into surplus remains well within reach. Reversing the full-year balance into positive territory requires a cumulative H2 surplus exceeding $1.26 billion. This equates to a monthly average surplus of approximately $210 million, a bar lower than the average monthly surplus recorded between March and June ($310 million). Nevertheless, the surplus margin could narrow if per-visitor spending declines or if outbound demand rebounds. Conversely, if inbound demand continues its upward momentum, the surplus could widen further.
Overall Evaluation and Key Implications
- The defining shifts in H1 2026 can be summarized as the quantitative expansion of inbound travel, gains in per capita tourism receipts, wider usage of regional entry gateways, outbound concentration in Japan, and a drastic narrowing of the tourism balance deficit. Future policy and industry strategies must focus not only on driving arrival numbers, but also on accurately measuring the economic impact of high-value segments like medical tourism, while linking them to duty-free/shopping recovery and extended regional stays. Simultaneously, the outbound sector must continuously monitor destination bias and demand volatility driven by shifting exchange rates and airline capacity adjustments.
 Prev
Prev  Back
Back 