
[Press Release] Both Inbound Tourist Numbers and Spend per Visitor Rise in H1 2026
- Reg Date
- 2026.08.10
Both Inbound Tourist Numbers and Spend per Visitor Rise in H1 2026
Increased Likelihood of an Annual Tourism Balance Surplus
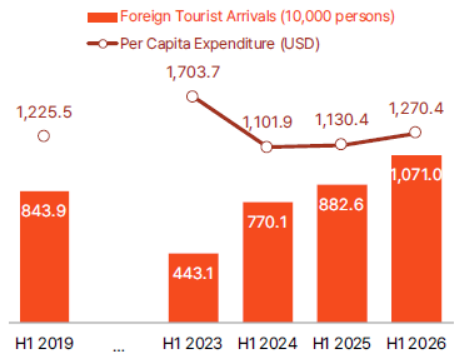
An assessment indicates that South Korea’s tourism balance in 2026 has a strong possibility of turning into a surplus. On August 7, Yanolja Research (Director: SooCheong Jang), a travel and tourism research institute, released its report titled "Analysis of Korea's Inbound and Outbound Tourism Performance for H1 2026." The report revealed that foreign tourist arrivals reached 10.71 million in the first half of 2026—a 21.3% increase year-on-year (YoY)—setting a new record high for any half-year period. This represents a 26.9% increase compared to the same period in 2019. During the same period, after shifting to a surplus in March, the tourism balance maintained a surplus for four consecutive months, opening up the possibility of an annual surplus transition.
Inbound Tourism Sees Growth Across Top 10 Source Markets… Regional Arrivals Also Increase
In the first half of 2026, the number of inbound foreign tourists reached 10.71 million, breaking the all-time high record. Notably, despite the escalation of war between the U.S./Israel and Iran in late February—which led to rising global jet fuel prices, flight detours, and supply adjustments—demand for visits to South Korea maintained an upward trajectory.
While the Asian market recorded 8.524 million arrivals (a 23.3% increase compared to 2019), non-Asian regions also demonstrated steady growth, continuing market diversification: Americas: 1.077 million (+12.7%), Europe: 739,000 (+20.2%), Oceania: 172,000 (+11.4%), Middle East: 150,000 (+12.9%), and Africa: 38,000 (+7.2%).
By country, China (3.212 million) and Japan (1.950 million) solidified their positions as the top two source markets. Taiwan posted the steepest growth among the top 10 countries with a 33.4% YoY increase, while all other top origin countries, including the U.S. and Hong Kong, recorded positive growth YoY.
Entry routes have also diversified. Inbound passengers through regional airports surged by 42.2% compared to 2019—double the growth rate of capital area airports (21.4%). Inbound traffic via regional seaports also jumped 63.8% compared to 2019, confirming a regional decentralization trend across both air and sea travel. This shows that the growing inbound demand is not concentrated solely in the capital area’s airports, but is dispersing toward regional airports and ports.
Tourism Receipts Exceed 2019 Levels in Both Total Amount and Spend per Visitor, Driven by Medical Tourism
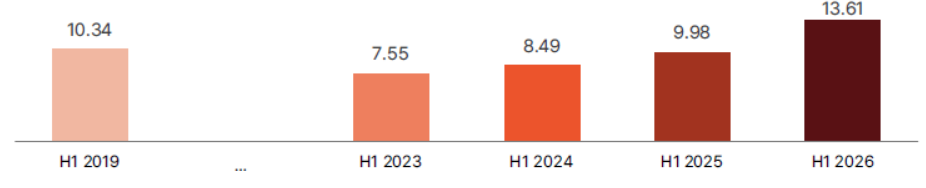
Half-year tourism receipts reached $13.61 billion, up 31.6% compared to 2019 and 36.4% YoY. Crucially, average spend per visitor reached $1,270.40, surpassing the 2019 level ($1,225.50) by 3.7%. This represents a 12.4% increase YoY, demonstrating that both the total revenue and per-visitor spending have fully recovered beyond pre-pandemic levels.
Medical tourism served as the primary growth engine behind this rebound. Foreign medical consumption during the first half reached approximately 1.1931 trillion KRW—a 6.6-fold increase compared to H1 2019 and a 59% increase YoY. Medical tourism, characterized by longer stays and higher expenditure, has established itself as a new high-value consumption pillar and a core driver in pushing up spend per visitor.
However, duty-free shops remain sluggish. Compared to H1 2019, duty-free store visitors dropped by 30.9%, and spend per visitor plummeted by 41.8%, shrinking total sales by 59.8% from $8.37 billion to $3.37 billion. Additionally, cruise passenger arrivals reached 481,000 in H1—more than a fourfold increase compared to 2019—putting downward pressure on average spend per visitor due to their shorter stays and lower spending scale.
Suckwon Hong, Senior Researcher at Yanolja Research, noted, "The group travel consumption model centered around duty-free shopping is fading, while extended-stay, high-involvement consumption such as medical and wellness tourism is rapidly taking its place. The fact that spend per visitor has surpassed 2019 levels signals a restructuring in the profitability model of Korea’s inbound tourism market."
Inbound Korean Tourists & Spend per Visitor Trends (10,000s, USD)
Tourism Receipts (USD Billion)
Outbound Travel Reverses Trend… Declines for Two Consecutive Months in May–June, Nearing 2019 Levels
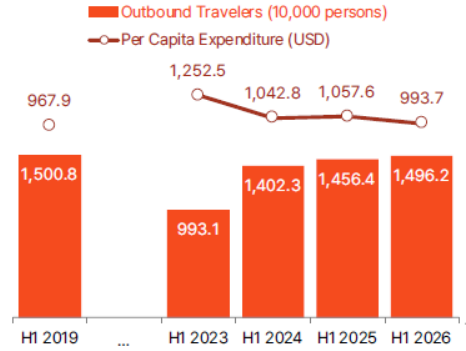
In contrast, the number of outbound Korean travelers in H1 2026 stood at 14.962 million. While this is just 0.3% below 2019 levels—nearly reaching pre-pandemic volume—it has yet to make a full recovery. Although it grew 2.7% YoY, monthly trends reached a downward inflection point: the upward trajectory seen from January through April reversed into two consecutive months of decline in May (-2.1%) and June (-10.0%). This slowdown is likely linked to macroeconomic factors such as rising global jet fuel prices following late February, adjustments in international flight capacity, and high exchange rates.
Under the pressure of rising travel costs, destinations shifted sharply toward "short-haul, cost-effective" options. The concentration on travel to Japan became particularly pronounced. Visitors to Japan reached 5.675 million—an increase of 46.9% compared to 2019 and 18.6% YoY—single-handedly driving the outbound market. Japan accounted for 37.9% of all outbound travel, a 12.2 percentage point rise from H1 2019 (25.7%). Vietnam (2.161 million, +4.0% vs. 2019) saw a slight YoY decrease of 2.1%, while China (1.714 million, +16.0% YoY) maintained its growth trend. Conversely, many long-haul and Southeast Asian destinations failed to recover to 2019 levels and remained weak, including the U.S. (-40.8%), Thailand (-35.3%), the Philippines (-40.5%), Hong Kong (-38.7%), and Macao (-36.9%).
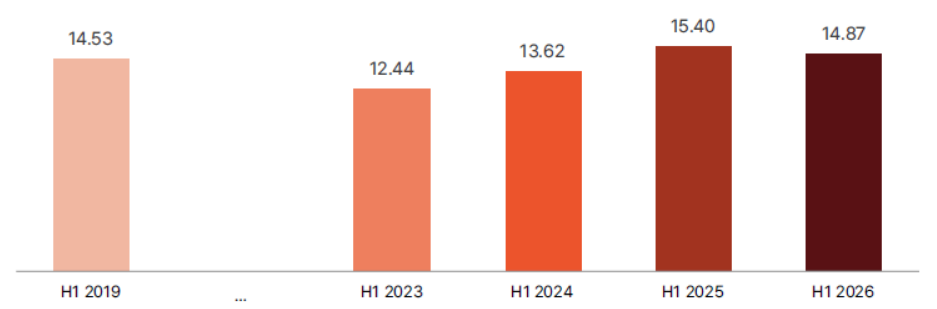
In terms of tourism expenditure, total outbound spending slightly exceeded 2019 levels due to higher spend per traveler, even though outbound volume was roughly on par with 2019. However, the YoY dynamic showed a different pattern. Outbound tourism expenditure in H1 2026 reached $14.87 billion—up 2.4% compared to 2019 ($14.53 billion), but down 3.5% compared to the previous year ($15.40 billion). Spend per visitor came in at $993.70, which is 2.7% higher than in 2019 ($967.90), but 6.0% lower than last year ($1,057.60). Due to the high exchange rate (average H1 2026 exchange rate: 1,483.9 KRW/USD), tourism spending converted into Korean Won increased by 32.9% compared to 2019.
Professor Kyuwan Choi of the College of Hotel & Tourism Management at Kyung Hee University stated, “The shift to declining outbound demand in May and June illustrates the impact that macroeconomic pressures—namely high exchange rates and airfare costs—have on travel sentiment. As these burdens persist, the trend of consumers prioritizing short-haul destinations that fit their budgets is likely to continue into the second half of the year.”
Outbound Korean Travelers & Spend per Traveler Trends (10,000s, USD)
Tourism Expenditure (USD Billion)
Tourism Balance Registers 4 Consecutive Months of Surplus… Growing Chance of Annual Surplus
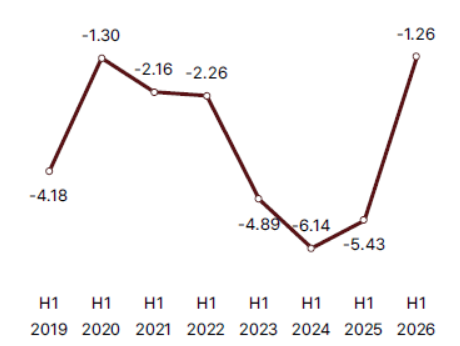
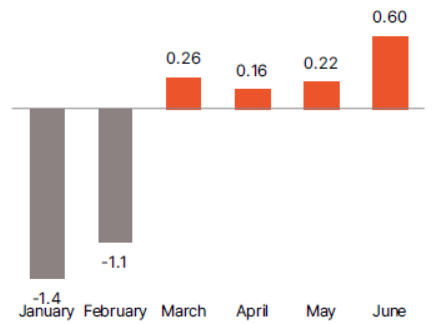
In January, outbound travelers outnumbered inbound visitors by 2.6 times. However, the gap narrowed dramatically starting in March, with the two figures nearly converging by June. In H1 2026, the overall tourism balance recorded a deficit of $1.26 billion. Although still in the red, the deficit shrank significantly compared to the same period in 2019 (-$4.19 billion) and 2025 (-$5.43 billion). After opening the year with deficits in January (-$1.4 billion) and February (-$1.1 billion), the balance flipped to a surplus in March (+$260 million) and maintained four consecutive months of surplus through June (+$600 million).
The direct cause of this improvement lies in the fact that tourism receipts surged 36.4% YoY while tourism expenditure decreased by 3.5%. Receipts were driven up by the dual impact of growing inbound visitor volume (+21.3%) and higher spend per inbound visitor (+12.4%). Meanwhile, even though outbound traveler volume grew slightly (+2.7%), a 6.0% decline in per-traveler spend led to a net drop in overall outbound expenditure. The report interprets H1’s improved balance as the combined effect of simultaneous volume and price increases in inbound travel, alongside a decline in outbound spend per visitor.
The report highlights the depreciation of the Korean Won as a key variable explaining this divergence. As the Won weakened, South Korea became a more price-attractive destination for foreign visitors, whereas traveling abroad became a greater financial burden for domestic residents—creating an asymmetrical effect. Consequently, outbound growth slowed starting in March, while inbound travel accelerated in a diverging trend.
On paper, an annual surplus is well within reach. If the second half achieves a cumulative surplus exceeding $1.26 billion, the full-year balance will flip to a surplus. This translates to an average monthly surplus of roughly $210 million—a lower threshold than the monthly average surplus achieved between March and June ($310 million). However, if inbound spend per visitor declines or domestic demand for outbound travel rebounds, the surplus margin could narrow. Conversely, if inbound demand maintains its current momentum, the surplus could expand further.
SooCheong Jang, Director of Yanolja Research, concluded, “Recording four consecutive months of a tourism surplus is an unusual trend. Because this outcome was created by the weak Won acting in opposite ways on inbound and outbound travel, exchange rate movements in the second half will be the critical variable determining whether South Korea achieves a full-year tourism surplus.”
H1 Tourism Balance in South Korea (USD Billion)
Monthly Tourism Balance of South Korea in 2026 (USD Billion)
 Prev
Prev  Back
Back 