
Vol.48 Financial Feasibility of Constructing a Large-Scale, 50,000-Seat Performance Venue
- Reg Date
- 2026.09.30


Financial Feasibility of Constructing a Large-Scale 50,000-Seat Performance Venue: Business Viability Conditions and Policy Tasks
Suckwon Hong, Senior Researcher at Yanolja Research / [email protected]
SooCheong (Shawn) Jang, Professor at Purdue University & Director at Yanolja Research / [email protected]
Kyuwan Choi, Professor at Kyung Hee University & Director at H&T Analytics Center / [email protected]
Executive Summary
- The growth of the domestic large-scale performance market and the limitations of existing performance infrastructure highlight the need to evaluate a dedicated 50,000-seat performance venue. This need is further reinforced by the concentration of demand for major performances in the Seoul Capital Area and the limited remaining capacity of key indoor performance facilities. However, it is crucial to note that the existence of demand does not automatically translate into commercial viability.
- A 50,000-seat venue requires a substantial initial investment. Construction-related costs are estimated at approximately 601.0 billion KRW, with average site acquisition costs in the Seoul area estimated at around 1.2072 trillion KRW. Furthermore, based on operating profit/loss including depreciation, most demand and revenue scenarios project operating losses. An operating profit of approximately 13.0 billion KRW is reachable only under the most favorable upper-bound conditions—where 36 performances per year, 1.8 million ticket sales, and high ancillary revenues are realized simultaneously.
- A challenge even greater than operational profitability is recovering the initial investment. Under the most favorable upper-bound conditions—combining the provision of public land, 60% government financial support for construction costs, 36 annual performances, 1.8 million tickets sold, and a premium revenue model—the pre-tax project Internal Rate of Return (IRR) reaches approximately 9.5%. However, this metric is an analytical baseline used to identify the conditions for financial feasibility, rather than a policy recommendation. Accounting for potential demand drops, early-stage ramp-up delays, and increases in operating and construction costs, the IRR could decline to around 3.0%–8.7%.
- Therefore, project viability depends less on the venue's scale itself and more on its location, investment structure, and operating/revenue models. Securing a location with strong transit and airport accessibility, as well as nearby accommodations and commercial areas, is essential. The project must also incorporate long-term partnerships with concert promoters alongside a diversified revenue model featuring naming rights, food & beverage, merchandise, and tourism tie-ins. Furthermore, a clear structural division of support scope and operational responsibilities between the public and private sectors is required.
Research Background: Expanding Large-Scale Performance Venues—From Need to Commercial Viability
Following the pandemic, South Korea's performance market has experienced rapid growth in both audience attendance and revenue. This expansion is particularly pronounced in the large-scale concert sector, centered on popular music, where K-pop’s global fandom provides a robust demand base. However, the infrastructure to accommodate this growth remains anchored in past capacities. Most of South Korea's major indoor performance facilities seat fewer than 20,000, leaving a structural absence of dedicated performance venues capable of hosting mega-artists with massive fandoms in a single show. As a result, Korean artists are forced to split their concerts across multiple dates, while international tours face severe constraints regarding venue scale and scheduling when considering South Korea.
Consequently, the industry has raised the need for dedicated 50,000-seat performance venues comparable to major Asian facilities such as the Tokyo Dome (55,000 seats) and the Philippine Arena (51,000 seats). In May 2026, the South Korean government formalized plans to construct a 50,000-seat "National Landmark Performance Venue" in the Seoul Capital Area—targeting groundbreaking in 2031 and completion in 2034—and initiated project implementation, including site discussions with local governments.1 As several municipalities—including Seoul, Incheon, Goyang, Hanam, and Busan—compete to build or host arenas, the focus of discussion has shifted from “Is it necessary?” to “Where, under what structure, and at whose expense should it be built?”
However, consensus on the need to expand large-scale venues does not equate to confirmed project viability. The industrial imperative of "necessity" belongs to a different dimension than the operational reality of "sustainable construction and operation." While critics rightly note that South Korea's shortage of large venues leads to missed opportunities to host world-class artists, a 50,000-seat facility represents mega-infrastructure requiring extensive land and immense capital expenditure. Even successful overseas precedents cannot be replicated directly if South Korea's market scale, land costs, transit conditions, and financing structures differ. Proceeding without thorough analysis risks turning the facility into a massive financial drain that imposes long-term fiscal burdens, rather than a celebrated regional landmark.
Therefore, any proposal for a large-scale performance venue must rigorously verify financial sustainability alongside social and cultural value. While cultural value justifies initiating a project, financial feasibility defines the conditions required to sustain that value over time. Without stable operations, anticipated benefits—such as concert hosting, tourism activation, and enhanced city branding—cannot endure. For these reasons, venue development must not degenerate into a mere political vanity project for local officials.
To this end, this report evaluates the financial feasibility of a 50,000-seat performance venue based on South Korea's historical performance data, the operational results of existing venues, and case studies of comparable domestic and international facilities. In this study, "feasibility" refers not to a social cost-benefit analysis, but to commercial financial viability based on the private sector's investment costs. Specifically, it assesses whether operational profitability can be expected upon completion and evaluates investment feasibility within set discount rate ranges based on 30-year pre-tax project cash flows. Non-financial benefits—such as impacts on tourism and regional economic development—are excluded from this scope and designated for separate benefit-estimation studies.
In summary, this report estimates the initial capital expenditures for a 50,000-seat venue, analyzes operational revenues and costs across various scenarios, evaluates investment recovery potential, and delivers strategic directions for government, municipal, and industry roles focused on “under what conditions and methods can construction and operation remain sustainable.”
Supply-Demand Imbalance in South Korea’s Large-Scale Performance Market
Rapid Growth in Demand for Large-Scale Performances
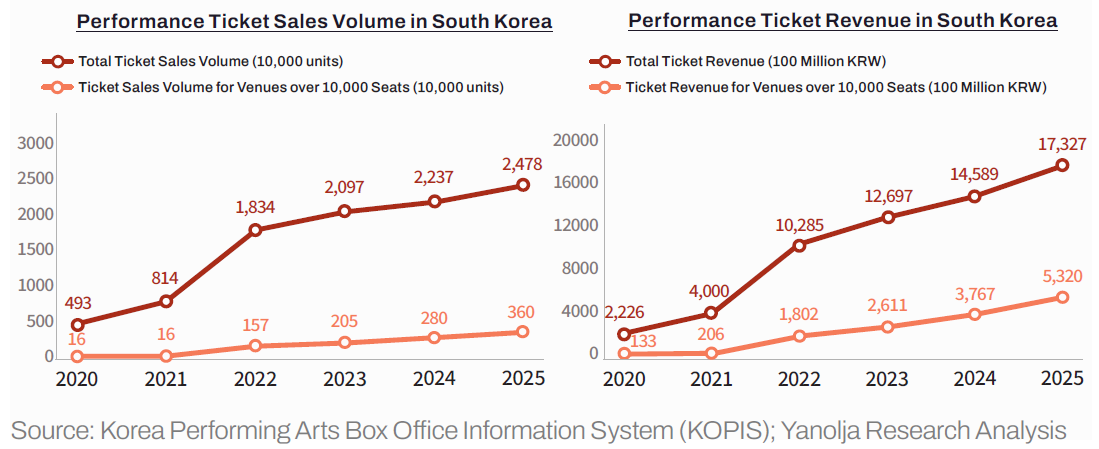
South Korea's performance market has demonstrated rapid growth since 2022. According to an analysis of data from the Korea Performing Arts Box Office Information System (KOPIS), total ticket sales across the entire performance market surged from 8.14 million tickets in 2021 to 18.34 million in 2022, signaling a strong recovery. By 2025, ticket sales reached 24.78 million, representing a 1.4-fold increase compared to 2022. Total ticket revenue grew 1.7-fold, rising from 1.0285 trillion KRW in 2022 to 1.7327 trillion KRW in 2025. This indicates that the market expansion was driven by both higher sales volumes and an increase in the average ticket price.
What stands out is that the large-scale performance sector grew far more aggressively than the overall performance market. Ticket revenue from performances held in facilities with a capacity of 10,000 seats or more tripled, jumping from 180.2 billion KRW in 2022 to 532.0 billion KRW in 2025. This translates to a compound annual growth rate (CAGR) of 43.5%, which is 2.3 times higher than the growth rate of the overall performance market (19.0%) over the same period. Consequently, the share of large-scale performances within total performance market revenue rose from 17.5% in 2022 to 30.7% in 2025. These results indicate a growing concentration of market expansion in the large-scale segment in South Korea.
The surge in the large-scale performance market is heavily centered on popular music (K-pop/pop). As of 2025, popular music accounted for 99.5% of total tickets sold for large-scale performances with capacities over 10,000 seats. In other words, popular music holds an overwhelming majority in the large-scale market, with K-pop—backed by its global fandoms—forming the primary demand base. This shift is driven by the growing number of Korean artists with massive international fanbases, such as BTS, BLACKPINK, and TWICE, which has generated escalating demand for venues capable of hosting large-scale crowds.
[Figure 1] Ticket Sales Volume and Revenue in South Korea's Performance Market
Structural Limitations of South Korea's Performance Infrastructure
(1) Indoor Performance Infrastructure Concentrated Under 20,000 Seats
In contrast to the rapidly growing demand, South Korea's performance infrastructure remains anchored in past capacities. There are only six major indoor performance facilities in South Korea capable of accommodating audiences over 10,000, and even these operate with capacities under 20,000 seats. A more critical issue is that the operating margin for key year-round venues in the Seoul Capital Area is extremely limited.
An analysis of the estimated operating capacity of major year-round venues, such as the KSPO Dome in Olympic Park and the INSPIRE Arena, reveals very little remaining capacity to host additional large-scale performances. In 2025, the KSPO Dome hosted 115 days of performances, with total venue rental days estimated at 285.2 Considering secondary uses such as corporate events and athletic competitions, this indicates minimal room to accommodate additional major shows. Similarly, the INSPIRE Arena, which opened in late 2023, hosted 32 events over 60 days in 2025. Its estimated rental period reached 178 days—a remarkable figure given it is still in its initial opening phase. Achieving this level of utilization despite being located on Yeongjong Island in Incheon, where accessibility is relatively limited, underscores the strong market demand for large-scale performances.
With year-round venue capacity constrained, concert promoters have increasingly relied on venues like the Gocheok Sky Dome and Jamsil Arena. However, these facilities face major limitations as home grounds for professional sports teams, which take scheduling priority. The Gocheok Sky Dome cannot host concerts during the baseball season, and Jamsil Arena suffers from scheduling conflicts during the basketball season, preventing year-round bookings. Nevertheless, hosting 25 and 52 days of performances respectively in 2025 demonstrates that strong demand persists despite these operational constraints. Furthermore, with Jamsil Arena scheduled for demolition, this supply bottleneck is expected to intensify in the short term.
Conversely, large-scale venue performance outside the Seoul Capital Area shows a sharp contrast. In 2025, the Sajik Arena in Busan hosted only two concerts, while the Gangneung Arena hosted none. This disparity highlights that current demand for large-scale performances, along with production networks, remains heavily concentrated in the Seoul Capital Area. However, this should not be interpreted as an immediate conclusion that "large-scale venues are unnecessary in regional areas." The low utilization rate in non-capital regions stems from a combination of factors, including secondary demand, transit accessibility, content-sourcing capabilities, surrounding commercial/accommodation infrastructure, and operator expertise. Therefore, new large-scale performance venues should prioritize the Seoul Capital Area, where demand and infrastructure are proven, while regional projects require separate feasibility studies that combine transit, tourism, lodging, and content strategies rather than constructing standalone venues.
These bottlenecks are mirrored in upcoming facility plans as well. Major venue projects currently under construction or in detailed planning—such as the Seoul Arena (Chang-dong; 25,000–28,000 seats) targeted for 2027, and the Goyang K-Culture Valley Arena (approx. 20,000 seats) whose completion has been delayed to 2030—remain capped at the 20,000 to 30,000-seat range. Consequently, even as supply expands, South Korea is unlikely to break through the structural “20,000-seat ceiling.”
[Table 1] Operational Status of Indoor Performance Facilities with Over 10,000 Seats in South Korea (2025)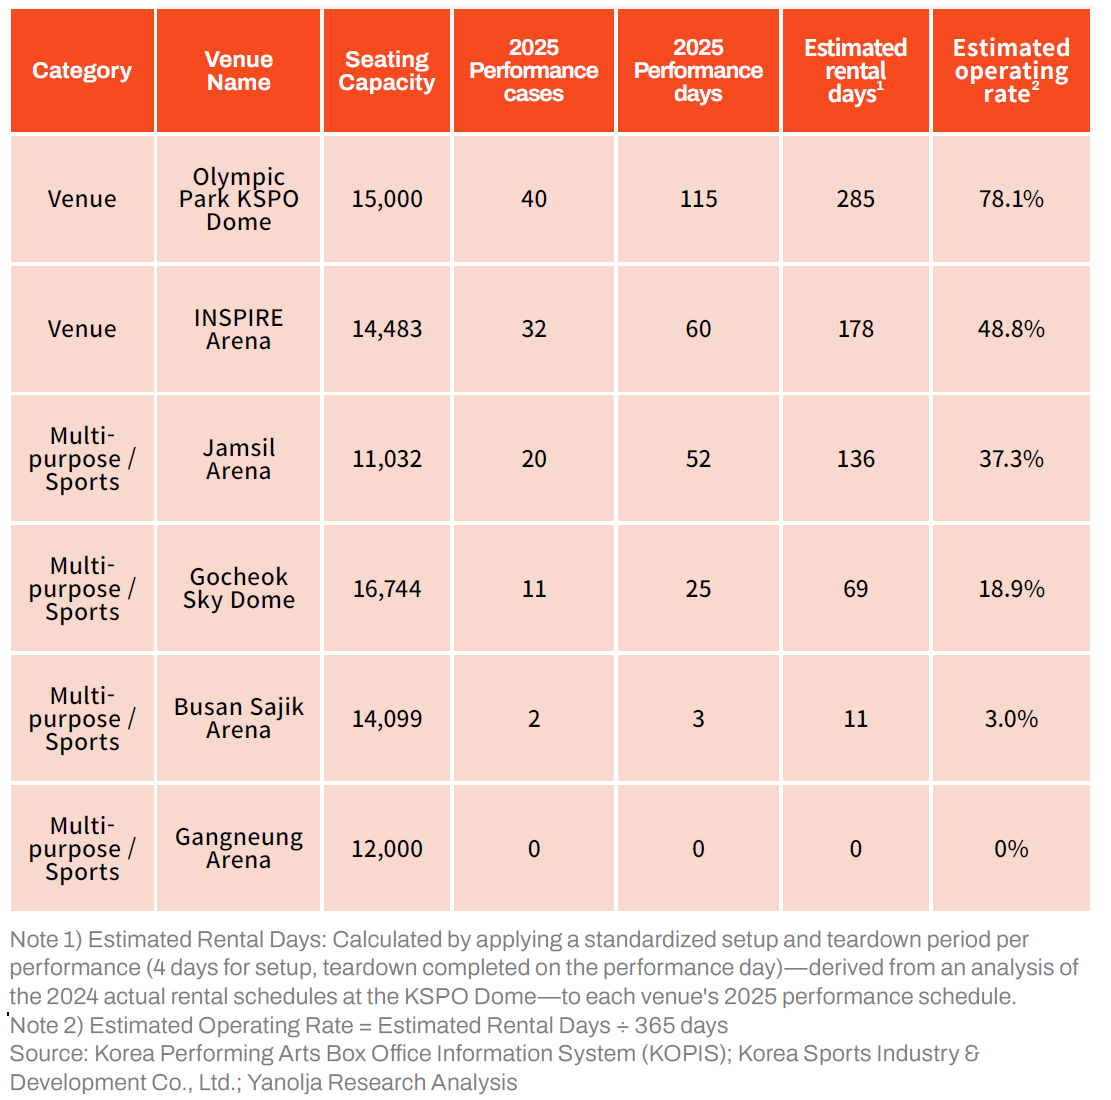
(2) Operational Limitations of Outdoor Stadiums
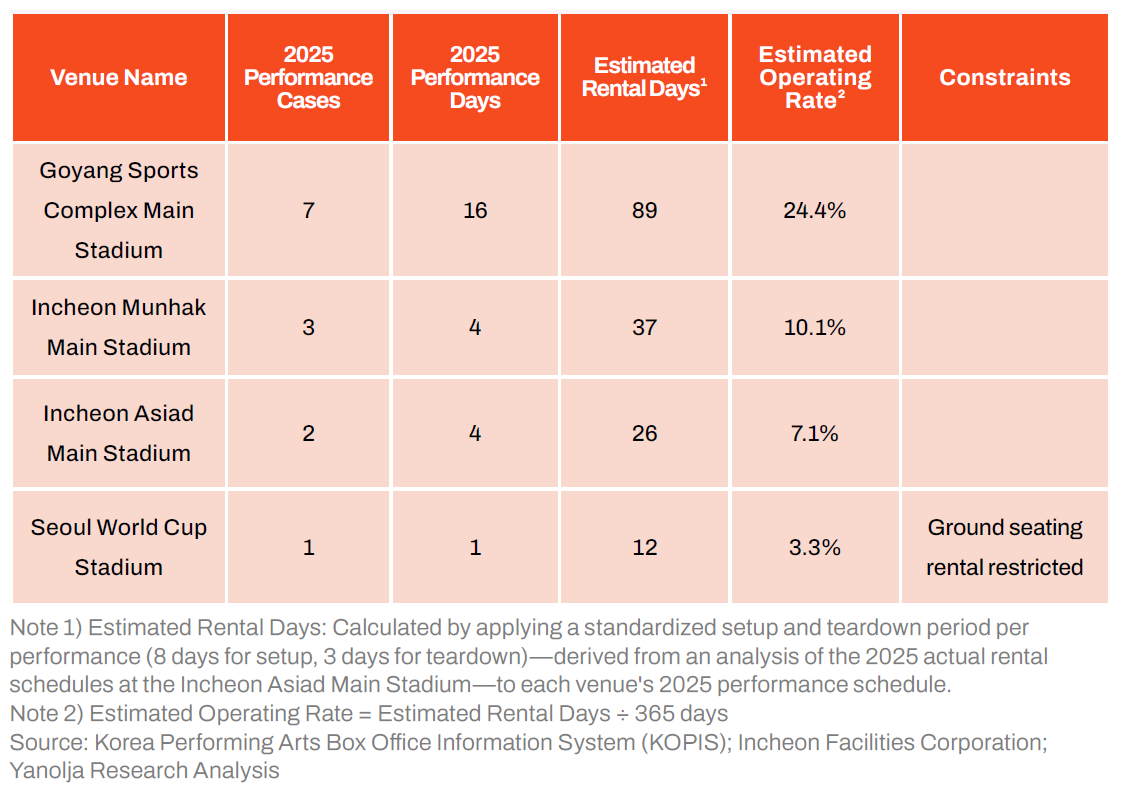
In the absence of indoor performance venues exceeding 20,000 seats, concerts requiring larger audience capacities rely on outdoor facilities such as multi-purpose sports stadiums. However, because outdoor stadiums are not dedicated performance venues, they present four major limitations: First, due to the lack of a roof, events are exposed to rain and extreme cold, making it practically impossible to host concerts from November through March. Second, as most stadiums serve as home grounds for professional soccer teams, the football season directly overlaps with peak concert schedules. Third, concerns over turf damage caused by audience seating often lead to restrictions on ground-seat ticket sales or outright refusals to host concerts, as seen in the case of Seoul World Cup Stadium. Fourth, because stage structures must be set up and dismantled for every show, promoters face heavy production costs, including extended venue rental fees and labor expenses. With the Seoul Olympic Stadium currently out of operation due to remodeling, major outdoor concerts are increasingly pushed to the outskirts of the Seoul Capital Area, such as Goyang and Incheon. However, this approach merely serves as a temporary stopgap for the lack of dedicated infrastructure and cannot offer a sustainable long-term solution in South Korea.
[Table 2] Concert Hosting Status of Major Outdoor Stadiums over 20,000 Seats in South Korea (2025)
Opportunity Costs Resulting from the Supply-Demand Imbalance
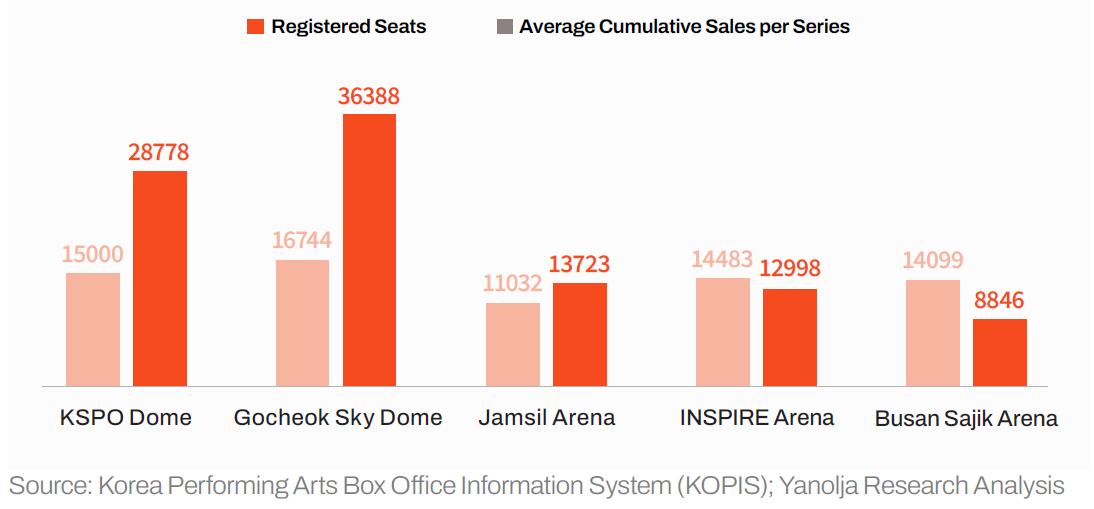
An analysis of performance records from 2025 across five indoor facilities with over 10,000 seats in South Korea (KSPO Dome, INSPIRE Arena, Jamsil Arena, Gocheok Sky Dome, and Busan Sajik Arena) reveals that the average cumulative ticket sales volume per concert series was approximately 21,519 tickets. In particular, the average cumulative sales volume per series at the KSPO Dome and Gocheok Sky Dome reached approximately 28,778 and 36,388 tickets, respectively, with an average of 2.5 shows per series across the five facilities. This demonstrates that existing indoor venues are securing substantial cumulative demand across multi-night runs. However, because cumulative sales represent aggregate totals from multiple shows, this figure should not be directly compared against venue seat capacities to imply that single-show demand exceeds current venue capacities.
There are also verified cases where artists drew significantly larger crowds at higher-capacity facilities. Comparing concerts by the same artist in 2025, one performance sold approximately 16,380 tickets per show at the Gocheok Sky Dome, whereas the same artist sold approximately 34,166 tickets per show at the Goyang Stadium. A similar twofold increase in per-show ticket sales was observed when comparing performances between the KSPO Dome and Goyang Stadium. These performance records demonstrate that certain shows possess the market potential to generate strong demand in venues far larger than existing indoor facilities. Nevertheless, because sales volumes vary based on performance timing, event programs, tour characteristics, and artist activities, it is difficult to attribute the entire sales increase solely to the expansion of venue scale.
These findings yield two primary implications. First, splitting a performance into multiple dates due to facility scale limitations or scheduling constraints generates additional operating costs and reduces available calendar slots that could otherwise be allocated to other shows. Second, even concerts capable of mobilizing massive audiences may fail to fully realize their potential demand without access to appropriate facilities. However, because multi-night concert runs are also influenced by repeat fan attendance, stage production requirements, and promoter strategies, the demand eligible for consolidation into single large-venue shows must be estimated by evaluating both per-show ticket sales and event characteristics, rather than relying on cumulative sales alone.
[Figure 2] Registered Seating Capacity and Average Cumulative Ticket Sales per Concert Series (2025) across Major Indoor Performance Venues in South Korea
In summary, a structural imbalance exists between rapidly growing demand and constrained supply within South Korea's large-scale performance market. While the large-scale performance sector has expanded faster than the broader market, indoor facilities capable of hosting such events remain limited, and outdoor stadiums face major challenges—such as weather risks, turf maintenance, scheduling conflicts, and high production costs—that prevent them from serving as sustainable long-term alternatives. Consequently, this bottleneck generates opportunity costs in the form of fragmented multi-night show schedules and unrealized latent demand. However, because various factors—including production budgets, exchange rates, and promoter strategies—interact simultaneously, it is difficult to attribute these phenomena solely to a shortage of venue infrastructure. Therefore, a 50,000-seat performance venue should be evaluated not as a panacea, but as a strategic alternative to alleviate these structural constraints.
A dedicated 50,000-seat performance venue can be considered an alternative solution to mitigate this supply-demand imbalance. In South Korea, existing concert runs drawing 70,000 to 160,000 cumulative attendees across multiple dates already confirm a baseline level of actual market demand, while major Asian facilities such as the Tokyo Dome and the Philippine Arena operate at around the 50,000-seat capacity. However, cumulative multi-night attendance cannot be assumed to convert directly into a single-show attendance figure. Realized demand varies based on repeat fan attendance, seating configurations, stage production setups, and ticket pricing. Therefore, 50,000 seats should be understood not as a fixed requirement, but as a baseline scale used to test both the commercial feasibility of global tours and actual domestic demand in South Korea.
Yet even if the industrial need is partially established, critical practical questions remain: How much capital is required to construct a 50,000-seat venue? Can the facility achieve operational profitability? Is the initial capital investment recoverable? To address these questions, the subsequent sections evaluate the initial capital expenditures, operational revenues and expenses, and the overall financial feasibility of constructing such a venue.
Capital Expenditure Analysis for Building a Large-Scale Venue
This section estimates the initial capital expenditures required to construct a 50,000-seat performance venue. The analytical timeline assumes groundbreaking in 2027, followed by a 3-year construction period, leading to an opening in early 2030. This baseline schedule is modeled on construction duration precedents from major domestic and international venues, such as the Philippine Arena (groundbreaking in August 2011, opening in July 2014) and the INSPIRE Arena (groundbreaking in May 2019, opening in December 2023). Furthermore, considering that demand for large-scale performances in South Korea is heavily concentrated in Seoul, this study estimates initial investment costs under the premise that the venue will be built within the city of Seoul. The price level is fixed as of January 2027, with costs divided into venue construction expenses and site acquisition costs. This baseline model is intended to compare the structural business viability conditions of a 50,000-seat venue, rather than serve as a project-specific preliminary feasibility study for a designated national flagship project, assuming constant 2027 prices and a 3-year construction timeline. Applying this model to projects targeting actual completion will require adjustments for construction costs, land values, and development schedules at the time of groundbreaking.
Venue Construction Cost Estimation
Construction-related expenses consist of venue construction costs, stage technology infrastructure setup costs, parking facility development costs, and associated project contingency fees. The required total gross floor area (GFA) is estimated at approximately 97,059 square meters (m2) by applying the per-seat GFA ratio of the Philippine Arena—a facility with similar capacity and structural design (a standalone, fixed large-space arena)—to a 50,000-seat scale. The unit construction cost is set at approximately 5.27 million KRW per square meter (m2), derived from the unit cost for new construction of cultural/assembly facilities in the Seoul Metropolitan Government's "Public Building Construction Cost Guidelines (2024)" and adjusted to January 2027 price levels using the Korea Institute of Civil Engineering and Building Technology (KICT) Construction Cost Index. Based on this unit cost, total venue construction cost is estimated at approximately 511.9 billion KRW. Because the January 2027 index reflects a projected value assuming that the average monthly growth rate from January to July 2026 persists, actual construction costs at the time of groundbreaking may vary.
To this figure, approximately 30.6 billion KRW is added for stage technology infrastructure—including stage machinery, acoustics, lighting, and video systems (calculated by applying per-GFA unit costs from internal data of comparable venues in South Korea)—along with 11.4 billion KRW for on-site parking construction. The parking facility is planned for 971 spaces across a surface parking area of 22,566 square meters, complying with the Seoul Metropolitan Government's Off-Street Parking Standards (1 space per 100m2 of facility area). Unit costs for surface parking were adjusted to January 2027 prices based on the Incheon Institute's "2025 Guidelines for Cost Estimation of Local Financial Investment Projects in Incheon." Architecture design fees, construction supervision fees, and project administrative contingencies were calculated using fee ratios from the Ministry of Economy and Finance's "Detailed Guidelines for the Preparation of the 2027 Budget and Fund Management Plan," while surveying and site investigation fees were set at 1% of combined construction costs. Summing these components yields total construction-related costs of approximately 601.0 billion KRW.
[Table 3] Estimated Construction-Related Costs for a 50,000-Seat Performance Venue (Unit: 100 Million KRW)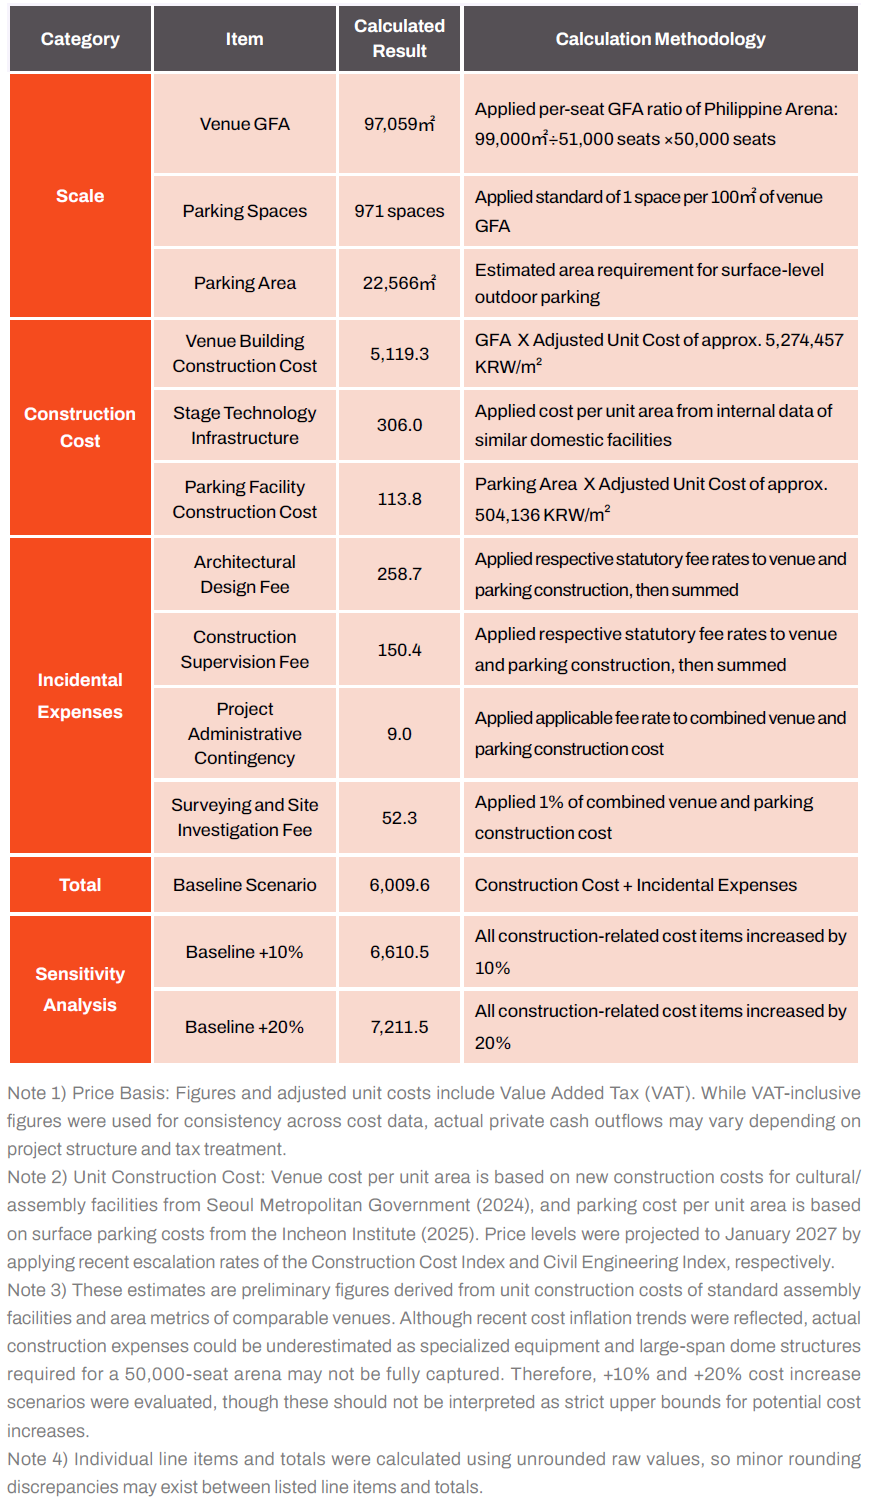
This estimate is a preliminary cost calculation performed before detailed design specifications and candidate sites are finalized; thus, it may not fully capture expenses associated with the large-span structural requirements, specialized performance specifications, and site-specific conditions of a 50,000-seat venue. For context, the Kai Tak Sports Park in Hong Kong, which opened in March 2025, incurred a total project cost of approximately 30 billion HKD (approx. 5 trillion KRW) for a multi-purpose complex that includes a 50,000-seat main stadium with a retractable roof, a 10,000-seat indoor arena, and commercial facilities. While a direct comparison is difficult due to differences in facility composition and specifications, this precedent highlights that actual construction costs for a 50,000-seat venue may substantially exceed preliminary estimates based on standard unit costs.
Accordingly, sensitivity analyses incorporating 10% and 20% increases in construction-related costs (approximately 661.1 billion KRW and 721.1 billion KRW, respectively) were included. Rather than predicting a specific level of cost overrun, these scenarios serve as test conditions to evaluate the impact of increased construction expenses on initial investment burdens, operational profit and loss, and investment feasibility; notably, these figures exclude land acquisition costs and contingency reserves.
Site Acquisition Cost Estimation
Site acquisition costs were estimated by calculating the required land area for venue development and applying time adjustments and compensation multipliers to the average official land value of standard lots in Seoul. The total land area requirement was divided into the base site for the venue and surrounding amenities, and the dedicated parking area.
The total required land area is set at approximately 95,115 square meters (m2), combining a base site requirement of approximately 72,549m2—derived by applying the per-seat land area ratio of the Philippine Arena to a 50,000-seat capacity—and the previously calculated parking lot area of approximately 22,566m2.The unit land price was established by taking the average official land value of standard lots in Seoul from the Proposed Official Public Price of Standard Lots and Housing (2026), adjusting it to January 2027 price levels using the Korea Real Estate Board's Seoul Land Price Index, and applying a compensation multiplier of 1.66—as mandated for the Seoul region in the Preliminary Feasibility Study Guidelines—to account for the absence of site-specific appraisal data at this stage. Based on these parameters, the total land acquisition cost is estimated at approximately 1.2072 trillion KRW.
[Table 4] Estimated Site Acquisition Costs for a 50,000-Seat Performance Venue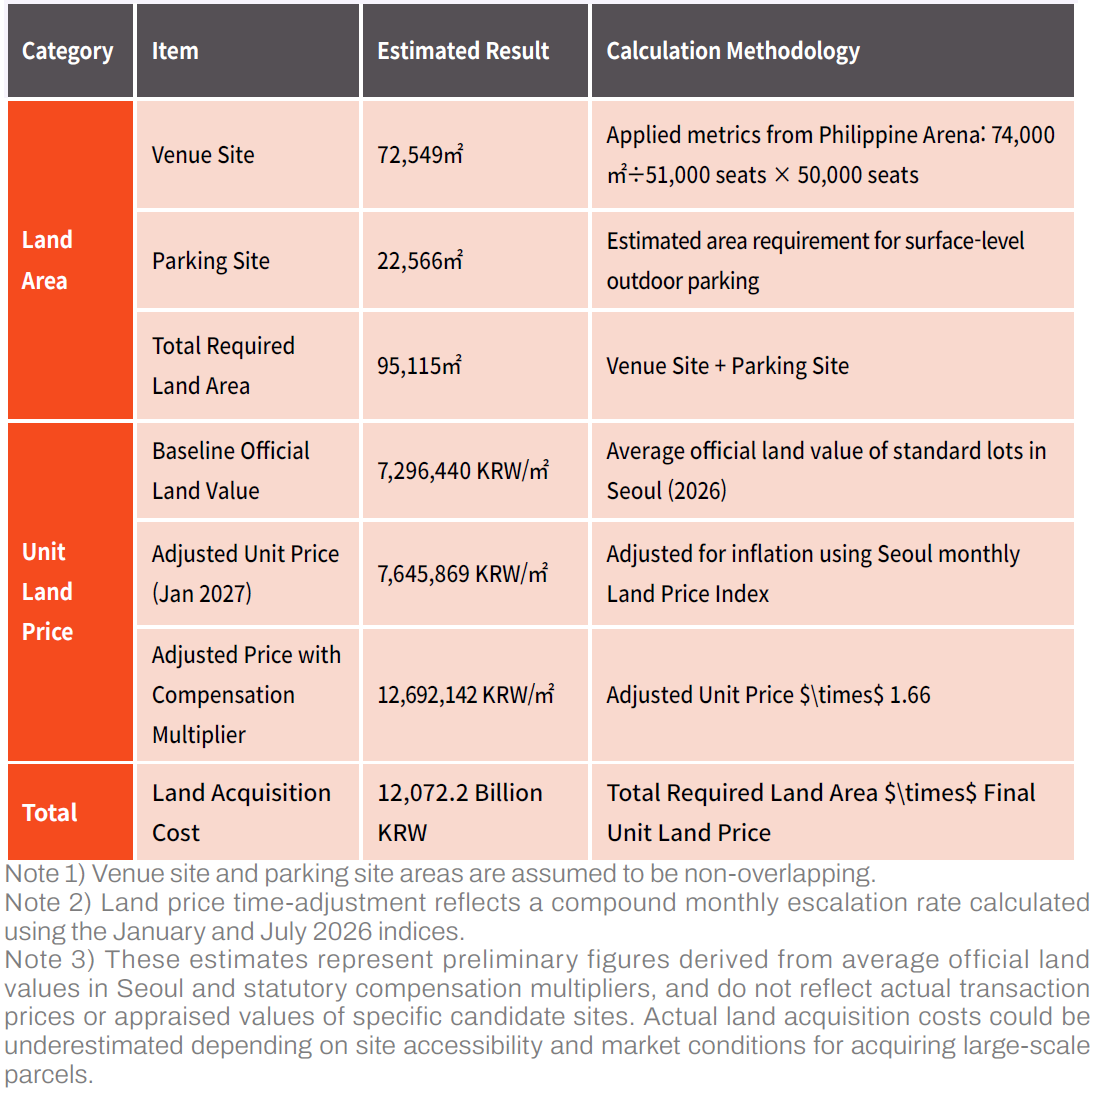
Initial Investment Costs by Site Acquisition and Public Support Models
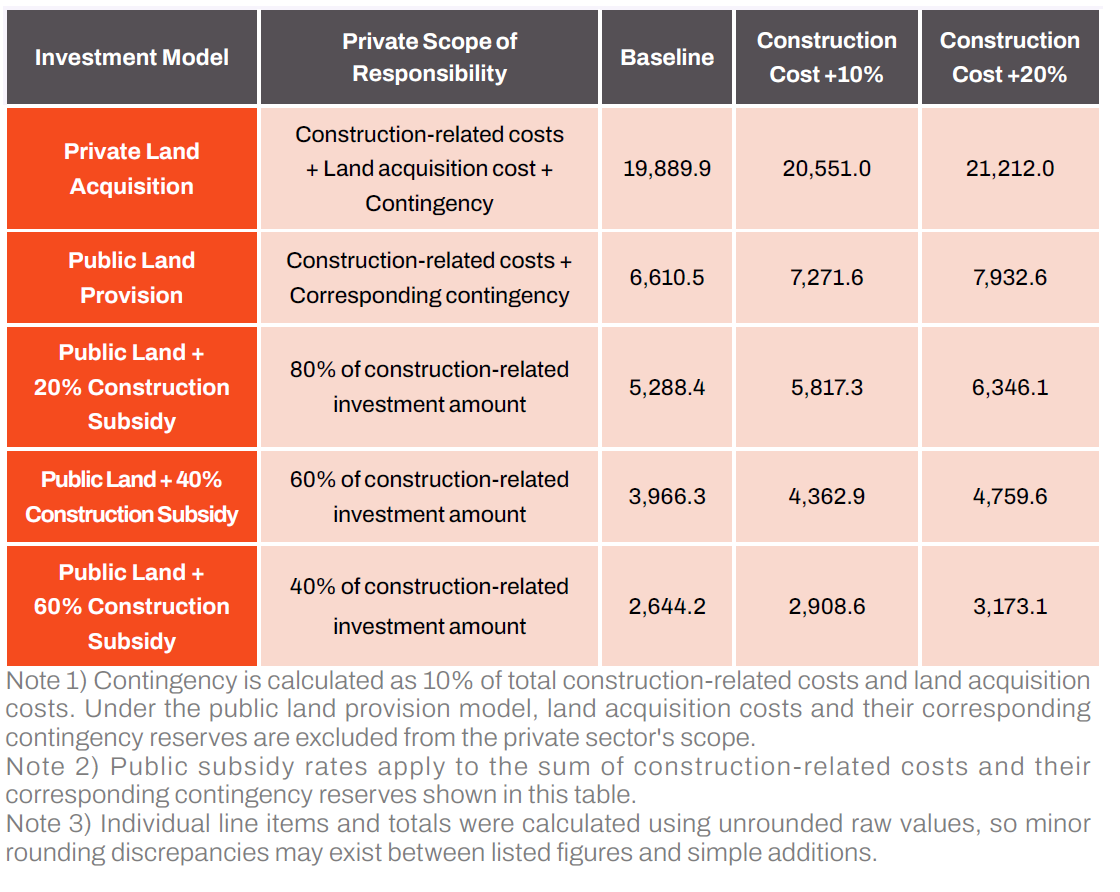
Based on the previously estimated construction-related expenses and site acquisition costs, the private sector's initial investment burden was evaluated under different site acquisition and public support frameworks. The investment models are categorized into three structures: (1) direct private land acquisition, (2) public land provision, and (3) public land provision combined with partial construction subsidies. Each model incorporates a 10% contingency reserve applied to both the construction-related costs and land acquisition costs borne by the private sector, while also evaluating scenarios where construction costs increase by 10% and 20% relative to the baseline.
The first model involves the private sector directly purchasing the land and constructing the venue. In the baseline scenario, adding the 10% contingency reserve to the construction-related costs of approximately 601.0 billion KRW and land acquisition costs of approximately 1.2072 trillion KRW yields an initial capital expenditure (CapEx) of approximately 1.9890 trillion KRW. While this allows the developer to secure full land ownership, it entails an extraordinarily heavy capital burden due to the acquisition of such a large parcel.
The second model entails the public sector providing the land, with the private sector bearing all construction-related costs. This study assumes conditions where no land acquisition cost or lease usage fee is charged to the private sector. In the baseline scenario, the private sector's initial investment cost is approximately 661.1 billion KRW, which sums the construction-related costs and the corresponding 10% contingency reserve. Providing the site substantially reduces the private sector's capital requirement; however, actual project execution requires clearly defining lease periods, facility ownership structures, and public interest mandates.
The third model combines public land provision with partial public subsidies covering construction-related investments. Considering that land provision alone may not secure investment feasibility, public subsidy rates were evaluated at 20%, 40%, and 60%. Subsidizable items include venue construction costs, stage technology infrastructure setup, parking facility development, administrative contingencies, and their corresponding contingency reserves. In the baseline scenario, the private sector's initial CapEx burden decreases to approximately 528.8 billion KRW, 396.6 billion KRW, and 264.4 billion KRW, depending on the subsidy rate.
The analysis indicates that the method of site acquisition and the extent of public support are critical determinants of the private sector's initial investment burden. However, public support does not eliminate project costs; rather, it reallocates financial burdens between the public and private sectors. Furthermore, construction subsidies alone do not increase venue operating revenues or reduce ongoing facility maintenance expenses. Therefore, subsequent analyses separately evaluate annual operating income/loss and long-term investment feasibility to determine the specific demand, revenue, and public support conditions required for project viability.
It is important to note that the subsidy rate represents a proportion of construction-related investment costs and does not reflect the public sector's total financial commitment. If public land is provided free of charge—assuming its economic value equals the estimated land price in this study—the public sector contributes real estate valued at approximately 1.2072 trillion KRW. Under a 60% construction subsidy rate, the public sector's total economic commitment—combining land value and construction subsidies (approx. 396.6 billion KRW)—reaches approximately 1.6039 trillion KRW, accounting for roughly 86% of the project's total initial investment value (approx. 1.8683 trillion KRW including land value). Here, 1.8683 trillion KRW represents the combined economic value of the public land and total construction-related investments (661.1 billion KRW), serving as a benchmark that excludes the land contingency applied under the direct private purchase model. At 20% and 40% subsidy levels, the public sector's economic contribution accounts for approximately 72% and 79% of total investment value, respectively. Although land provision may not involve immediate cash outflows, it foregoes opportunities to sell or develop the parcel for alternative uses; thus, a clear distinction must be made between actual public cash expenditures and broader economic commitments.
[Table 5] Private Initial Investment Costs by Site Acquisition and Public Support Models (Unit: 100 Million KRW)
Annual Operational Profit and Loss Analysis for the Performance Venue
Having examined the initial capital expenditures required to construct a 50,000-seat performance venue, this section evaluates the operational profit and loss by projecting the balance between post-opening revenues and expenses. Revenues were estimated based on revenue models adopted by major large-scale performance venues in South Korea, with scenarios analyzed according to performance demand and operational strategies. Operating expenses were calculated using operational data from comparable domestic and international facilities alongside public facility operating standards.
Operational Revenue Estimation
Venue revenue consists of facility rental fees and ancillary business revenues. In this study, rental revenue is divided into basic rental fees and ticketing commission fees. Basic rental fees were calculated by applying a fixed daily rate to total rental days, including stage setup and teardown periods. Ticketing commission fees were calculated by multiplying projected ticket sales volume by average ticket prices and commission rates.
Venue revenues vary depending on market conditions and operational strategies. Therefore, this study analyzed a total of 12 scenarios by categorizing performance demand into 4 levels and revenue structures into 3 levels. Demand scenarios represent how many performances the venue can attract, while revenue structures reflect the venue's pricing policies and operational strategies.
(1) Demand Scenarios
Performance demand represents the annual audience capacity and number of hostable performances for a 50,000-seat venue. Because no dedicated 50,000-seat performance venue currently exists in South Korea, direct observations of demand at this scale are unavailable. Consequently, candidate performances were selected based on ticket sales volume and performance frequency per show across major large-scale venues in South Korea in 2025, incorporating conditions for demand reproducibility and ticket sales capacity at a new venue.
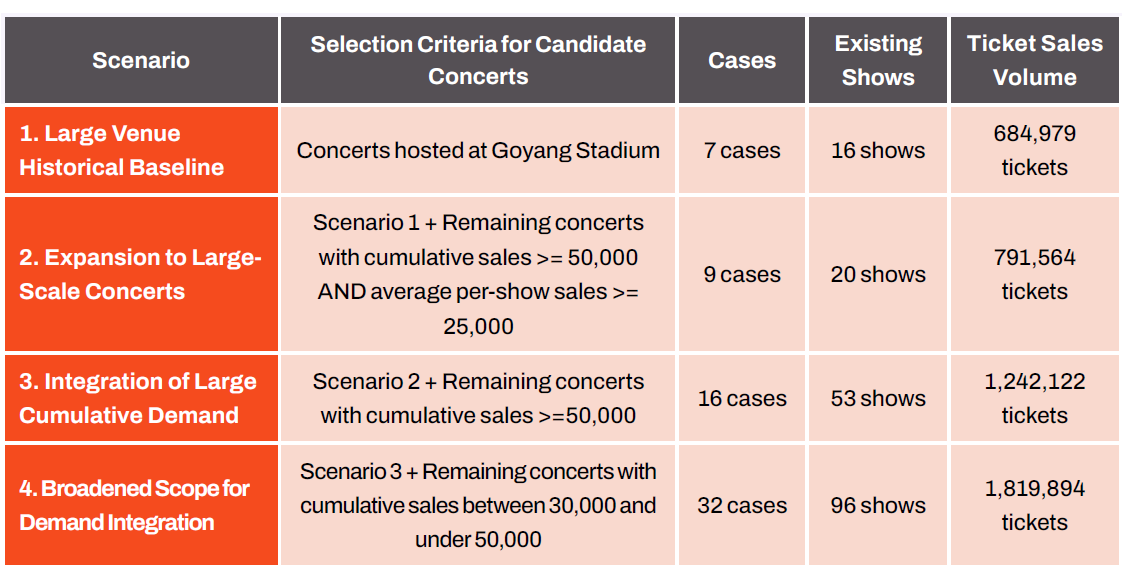
Candidate performances were categorized using both cumulative ticket sales volume (50,000 or more; 30,000–50,000; and under 30,000) and average sales volume per show. In 2025, approximately 685,000 tickets were sold across 7 concert series at Goyang Stadium, with cases where a single show sold over 50,000 tickets, confirming the existence of demand matching a 50,000-seat capacity. On the other hand, multi-night concerts held at indoor venues in the 10,000-seat range may have been fragmented due to venue scale or scheduling constraints; however, whether these can be consolidated into a smaller number of large-scale shows requires separate evaluation. The threshold for average sales volume per show was set at 25,000 tickets, referencing the lowest per-show sales level observed at Goyang Stadium (approx. 26,000 tickets). This threshold serves as an analytical baseline to distinguish between large-scale single-show records and multi-night cumulative totals, rather than representing the minimum sales volume required to host a concert at a 50,000-seat venue.
[Table 6] Distribution of Concert Performance Records by Cumulative and Average Per-Show Ticket Sales
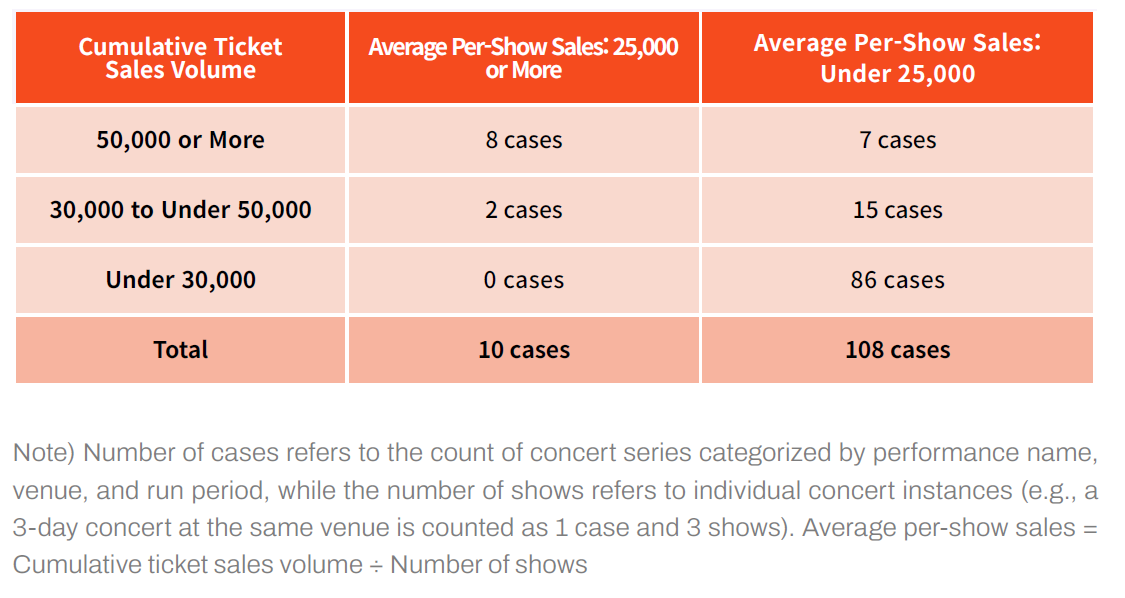
Based on these criteria, four scenarios were formulated by varying the scope of included candidate performances. Scenario 1 includes only performances held at Goyang Stadium. Scenario 2 expands this scope by incorporating performances that achieved both a cumulative sales volume of 50,000 or more and an average per-show sales volume of 25,000 or more. Scenario 3 operates under the assumption that multi-night demand for performances with cumulative sales of 50,000 or more can be consolidated into a single large-venue show, even if their per-show sales were lower. Scenario 4 further expands the consolidation target to include performances with cumulative sales of 30,000 or more. These scenarios do not assume that all included performances will fully sell out 50,000 seats; rather, they broaden the range of potential candidate demand, with subsequent scenarios making stronger assumptions regarding demand transferability and show consolidation.
[Table 7] Candidate Concerts and 2025 Performance Records by Demand Scenario
Because annual performance records from 2025 are unlikely to recur identically every year, and audience retention may be incomplete during venue transitions, a "demand realization coefficient" (80–100%) was applied to account for the proportion of observed performance records transferable to the new facility. Annual potential demand was calculated by multiplying the sum of ticket sales from candidate performances by this coefficient, and the planned number of shows was determined by dividing potential demand by 50,000 seats, rounding down to the nearest integer.
Furthermore, because sellable capacity may be reduced due to stage configurations or sightline restrictions, and unsold seats may occur, a "sellable seat ratio" and a "seat load factor (paid capacity utilization rate)" were each assumed at 80–100% to derive projected ticket sales volumes. Both ratios serve as analytical assumptions rather than empirical operating results; even if sales fall short of projections, the number of shows is assumed not to increase to compensate for lower demand. The venue rental duration per performance instance was set at a total of 7 days (5 setup days, 1 performance day, and 1 teardown day), while the facility operating rate represents calendar occupancy, calculated by dividing total annual rental days by 365 days.
[Table 8] Estimated Results by Demand Scenario for a 50,000-Seat Performance Venue
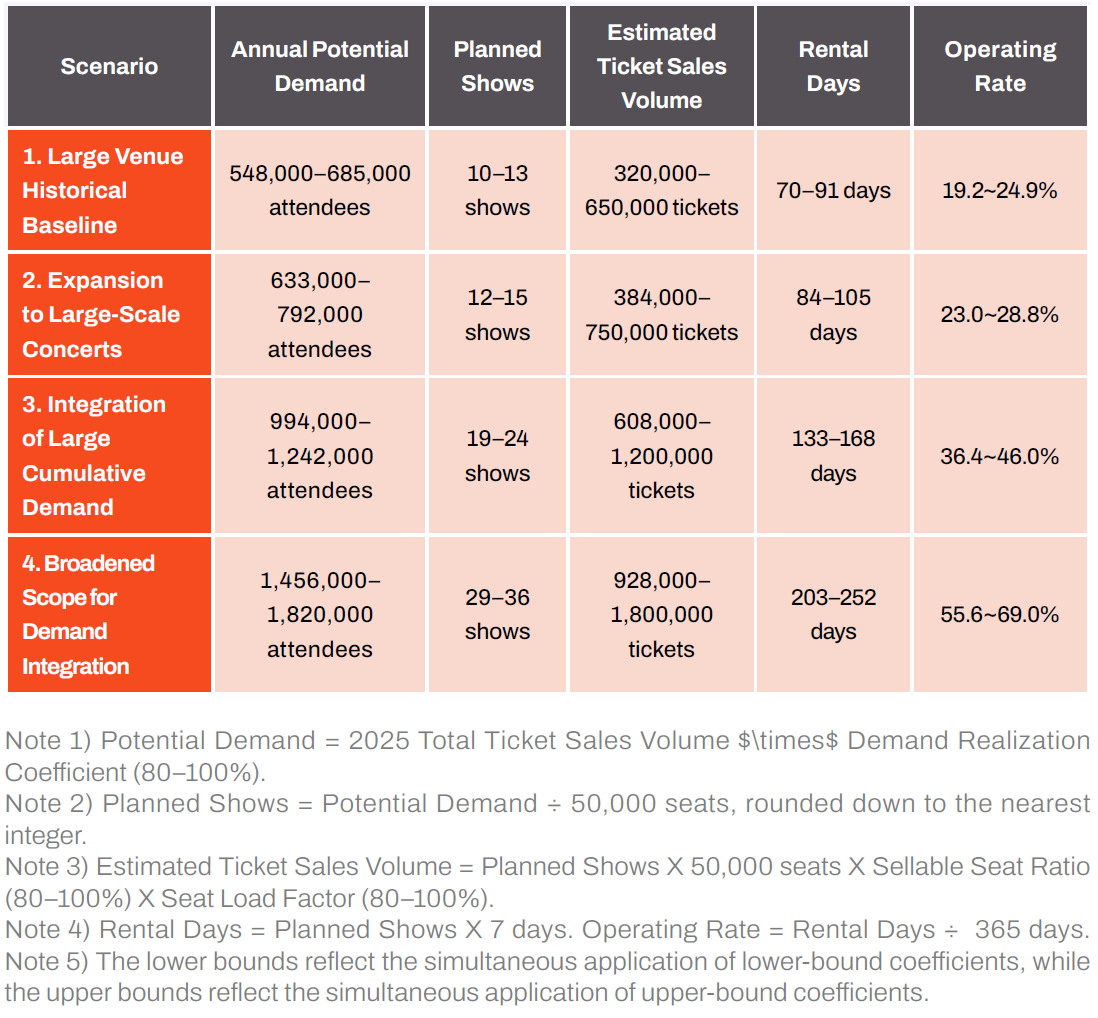
This estimation represents a conditional analysis intended to compare demand scale based on the scope of candidate performances and operational conditions. Actual demand may vary depending on the new venue's attraction capabilities, demand dispersion among competing facilities, and the feasibility of consolidating repeat concertgoers. Furthermore, the total aggregated number of shows does not guarantee scheduling feasibility for individual performances, nor does it account for operational efficiencies—such as shared setup and teardown periods during consecutive show runs. With these limitations in mind, the subsequent operational profit and loss analysis cross-analyzes the four demand scenarios against three revenue structures to evaluate the conditions under which operational viability is achieved.
(2) Revenue Structure Scenarios
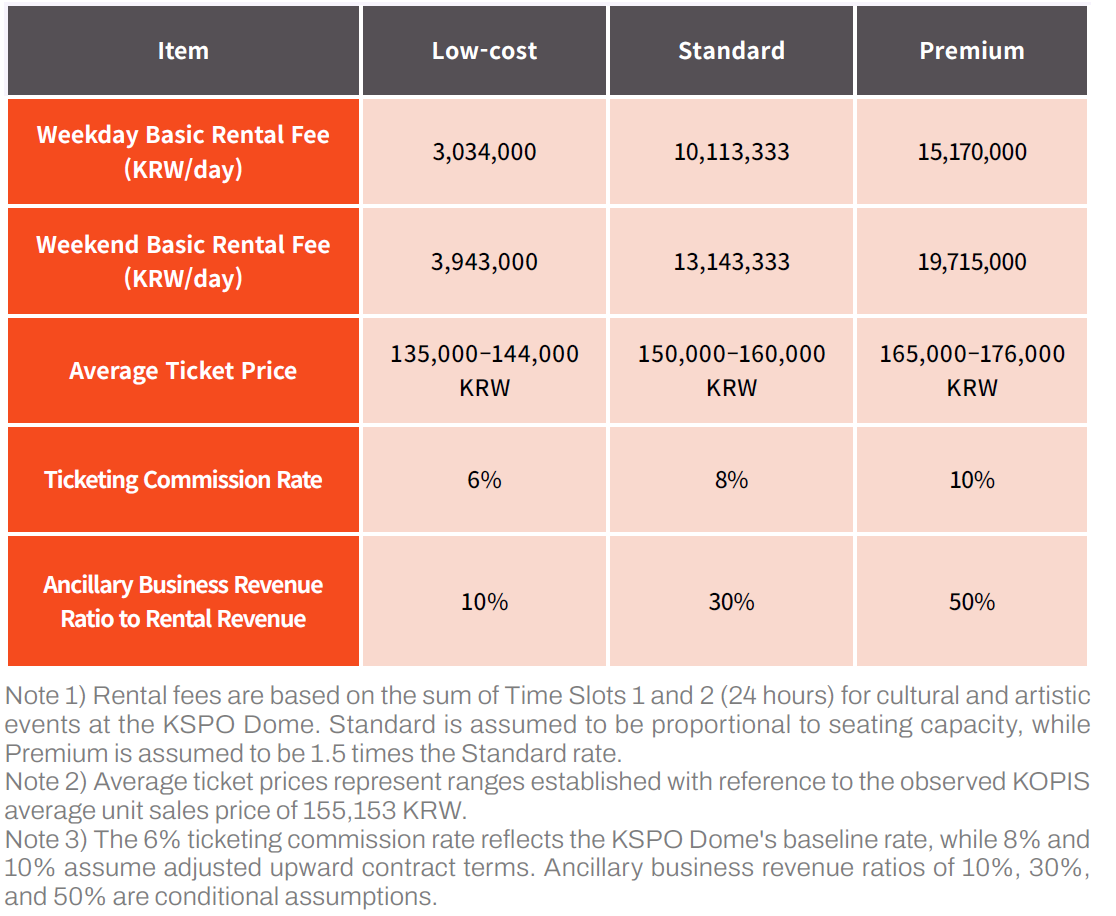
This study identified basic venue rental fees, average ticket prices, ticketing commission rates, and the ratio of ancillary business revenue relative to rental revenue as key analytical variables, establishing three revenue structures: Low-cost, Standard, and Premium. Ancillary business revenue encompasses income achievable by the venue operator, including naming rights, advertising, commercial space leasing, and concessions/merchandise sales commissions.
The benchmark for basic rental fees and ticketing commission rates was set using the Olympic Park KSPO Dome in South Korea. The KSPO Dome was selected because its regulatory framework explicitly separates basic rental fees from ticketing commissions—aligning perfectly with this study's revenue breakdown—and its rate schedules categorized by day of the week, time slot, and event type are publicly disclosed, providing verifiable benchmarks. Basic rental fees were calculated based on a 24-hour daily rental rate incorporating both Time Slot 1 and Time Slot 2 for cultural and artistic events.
Regarding ticket prices, considering that pricing is governed more by performance content and audience willingness-to-pay than by facility fees alone, real-transaction data from venue facilities with over 10,000 seats between January and August 2026 was retrieved from the KOPIS (Korea Performing Arts Box Office Information System) database. The average unit sales price calculated by dividing total ticket sales value by total ticket sales volume in this dataset was approximately 155,153 KRW. Based on this, the average ticket price for the Standard revenue structure was set within the range of 150,000 to 160,000 KRW. This formulation references observed 2026 market prices under the assumption that nominal ticket prices will remain at this level through the opening year of 2030; thus, operational revenues, like operational expenses, are interpreted in terms of 2030 price levels.
Ancillary business revenue is difficult to estimate item-by-item prior to finalizing contract terms and operational scopes for individual business lines. Therefore, referencing the revenue diversification model of the Saitama Super Arena in Japan—a entity whose financial records are publicly available as an independent corporate entity—ancillary revenues were estimated by applying fixed ratios relative to overall rental revenues. However, because that corporate entity also operates surrounding commercial spaces in addition to the arena itself, its overall corporate revenue structure cannot be directly applied to a standalone performance venue in South Korea. Consequently, the ancillary business revenue ratio was established as a scenario variable based on operational parameters rather than an empirical average from existing domestic venues.
The three revenue structures were formulated to compare the venue's pricing policies and operational strategies under consistent analytical parameters. As the scenarios progress from Low-cost to Premium, basic rental fees, average ticket prices, ticketing commission rates, and ancillary revenue ratios increase simultaneously; however, this does not imply that these variables necessarily rise in tandem in actual commercial markets. In particular, because ticket prices are heavily influenced by promoter pricing strategies and event lineups, they must be interpreted separately from variables under direct control of the venue operator.
First, the Low-cost Revenue Structure assumes a state where scale-based fee premiums for a 50,000-seat capacity are not fully recognized, and ancillary businesses are operated at a limited scale. Basic rental fees are set equal to the 15,000-seat KSPO Dome, and the average ticket price is set 10% lower than the Standard level. The ticketing commission rate is set at 6%, matching the KSPO Dome's baseline rate. Ancillary business revenue is fixed at 10% of total rental revenue, reflecting baseline income achievable during early operational phases.
Second, the Standard Revenue Structure assumes that the venue secures rental fees commensurate with its scale and operates ancillary businesses at a standard operational level. Basic rental fees are calculated at approximately 3.33 times the KSPO Dome rate by applying the seating capacity ratio. Average ticket prices fall within the observed market average range, while the ticketing commission rate is set at 8%, and the ancillary business revenue ratio is set at 30% of total rental revenue.
Third, the Premium Revenue Structure assumes a scenario where the venue commands high ticket pricing and strong bargaining power, actively operating ancillary business lines. Basic rental fees are set 50% higher than the Standard level, and the average ticket price is set 10% higher. The ticketing commission rate is set at 10%, with the ancillary business revenue ratio set at 50% of total rental revenue.
Annual basic rental fee income was calculated by multiplying planned shows by the per-performance rental fee. Based on the weekly operational model established previously, each performance instance was charged for 5 weekdays and 2 weekend days. Ticketing commission revenue was derived by multiplying annual estimated ticket sales volume (reflecting sellable seat ratios and seat load factors) by average ticket prices and commission rates. Total annual gross revenue was computed by applying the ancillary business revenue ratio to the combined rental revenues and adding the resulting ancillary income.
By combining these three revenue structures with the four demand scenarios established earlier, operational revenues across a total of 12 cases were evaluated. However, because expanding ancillary operations may require additional facilities and operational costs, a higher ancillary revenue ratio does not automatically guarantee an equivalent increase in net profit. In actual project planning phases, individual line-item revenues must be evaluated alongside their corresponding capital investments and operational expenses.
[Table 9] Revenue Structure Scenarios for a 50,000-Seat Performance Venue
Operating Cost Estimation
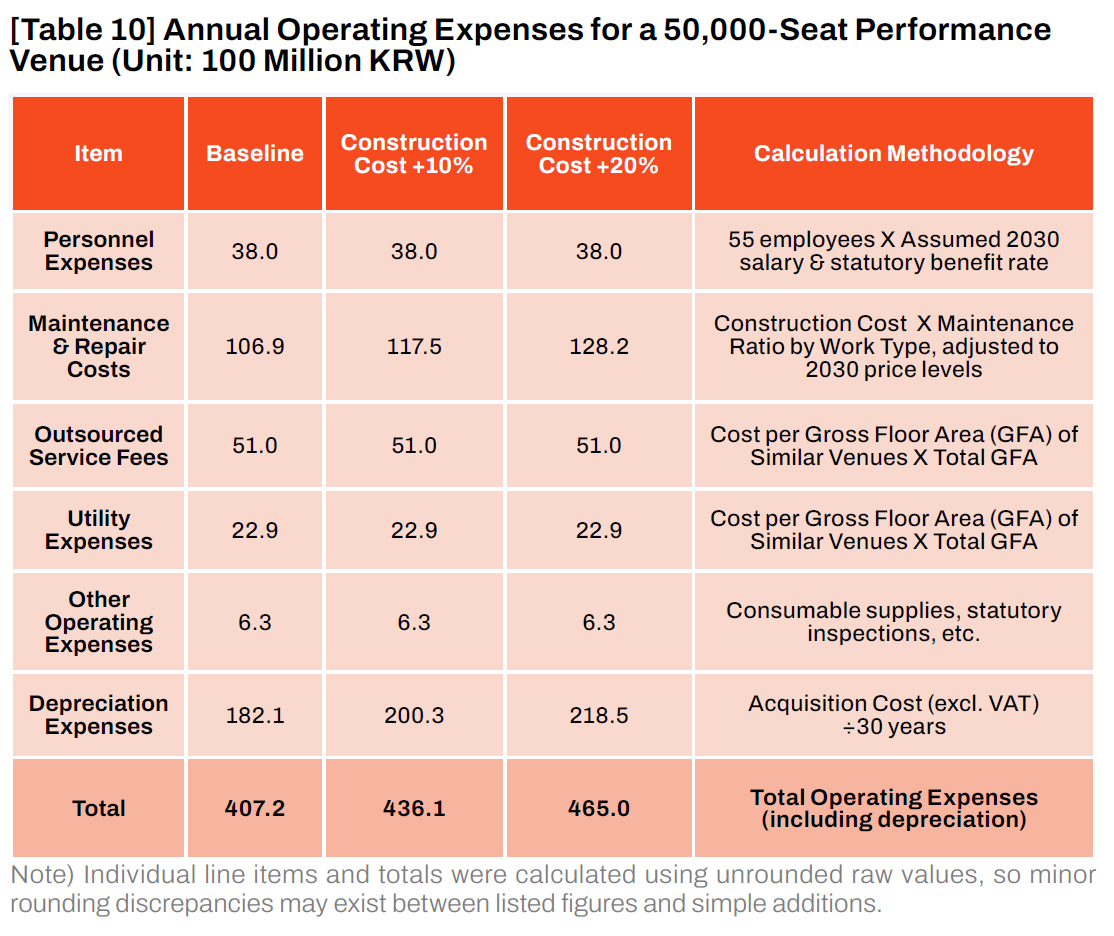
Annual operating expenses incurred after the opening of the venue were calculated by summing personnel expenses, maintenance and repair costs, outsourced service fees, utility expenses, and other administrative expenses. To ensure analytical objectivity, operational data from comparable domestic and international facilities alongside public facility management guidelines were utilized. Operating expenses were adjusted to reflect 2030 price levels at the projected opening date.
Personnel expenses include basic salaries and statutory benefits, modeled on the organizational structure and staffing system of the Saitama Super Arena (37,000 seats) in Japan. Because this facility is operated by an independent corporate entity (Saitama Arena Co., Ltd.), it serves as an ideal benchmark for identifying the labor force required for a large-scale dedicated venue. According to semi-public corporate disclosure data published by Saitama Prefecture, the full-time workforce operating the 37,000-seat facility stands at 41 employees (as of April 2025). Proportioned linearly by seating capacity to a 50,000-seat scale, the required workforce is estimated at approximately 55 employees. Combining this headcount with average monthly wages for permanent employees in South Korea—derived from the Ministry of Employment and Labor's Monthly Labor Survey (2025), compounded annually at recent 3-year average growth rates to 2030—and adding statutory benefits (four major social insurances, long-term care insurance, and severance pay obligations), total annual personnel expenses are estimated at approximately 3.8 billion KRW.
Maintenance and repair costs represent ongoing expenditures required to preserve facility functionality, calculated using the Incheon Institute's "2025 Guidelines for Cost Estimation of Local Financial Investment Projects in Incheon." For the main venue building and stage technology infrastructure, work-type construction cost proportions and maintenance factors for standard commercial buildings were applied, while civil engineering maintenance factors were applied to surface-level parking facilities. Adjusting these figures to 2030 price levels using recent inflation rates of the Construction Cost Index yields annual maintenance and repair costs of approximately 10.7 billion KRW. This figure reflects an annualized average of long-term repair and replacement costs and does not directly model variations between early-stage operations and post-depreciation facility aging.
Outsourced service fees cover facility management, security, and sanitation services, calculated at approximately 5.1 billion KRW by applying unit operating costs per gross floor area (GFA) from comparable domestic venues in South Korea adjusted to 2030 price levels. Utility expenses were estimated in the same manner at approximately 2.3 billion KRW, while other administrative expenses—including consumables and statutory inspection fees—were calculated at approximately 600 million KRW.
Depreciation expenses for buildings and structures were calculated based on the total acquisition cost, summing venue construction expenses, stage technology infrastructure setup, parking facility development, and directly attributable administrative project costs. A straight-line depreciation method with a 30-year useful life and zero residual value was applied uniformly. Under these parameters, annual depreciation expenses amount to approximately 18.2 billion KRW.
Summing these line items yields an estimated total annual operating expense of approximately 40.7 billion KRW under the baseline scenario. Under the +10% and +20% construction cost escalation scenarios established previously, maintenance/repair costs and depreciation expenses are assumed to increase proportionally by 10% and 20%, respectively. Assuming all other operational expenses remain constant, total annual operating expenses under these scenarios rise to approximately 43.6 billion KRW and 46.5 billion KRW, respectively.
A substantial portion of these operating expenses represents fixed costs. Because personnel expenses, maintenance obligations, and depreciation accrue constantly regardless of show volume or calendar vacancies, monetizing non-performance days is as critical as filling audience seats. Nevertheless, because certain variable components—such as utilities, security/sanitation costs, and facility wear-and-tear—may scale with show frequency and audience volume, detailed project planning phases require a rigorous breakdown separating fixed and variable costs. Accordingly, the stress test detailed in subsequent sections separately evaluates the impact of increased cash operating expenses driven by high venue operating rates on overall investment feasibility.
[Table 10] Annual Operating Expenses for a 50,000-Seat Performance Venue (Unit: 100 Million KRW)
Profit and Loss Analysis by Scenario
By integrating the previously projected performance demand, revenue structures, and operating expenses, the annual operating profit and loss for the 50,000-seat performance venue was evaluated. A total of 12 cases—combining four demand scenarios with three revenue structure scenarios—were compared. Operating profit or loss was derived by deducting total annual operating expenses from total gross revenue (the sum of basic rental fees, ticketing commission revenues, and ancillary business income). The analysis first evaluates results under the baseline construction cost scenario, followed by an assessment of impacts stemming from potential construction cost increases.
The lower and upper bounds of the results represent the range of profit/loss fluctuation under the defined conditions, calculated by simultaneously applying the lower and upper bounds of the demand realization coefficient, sellable seat ratio, seat load factor, and average ticket prices, respectively. Within the same demand scenario, the number of planned shows and projected ticket sales volume were held constant while varying the revenue parameters.
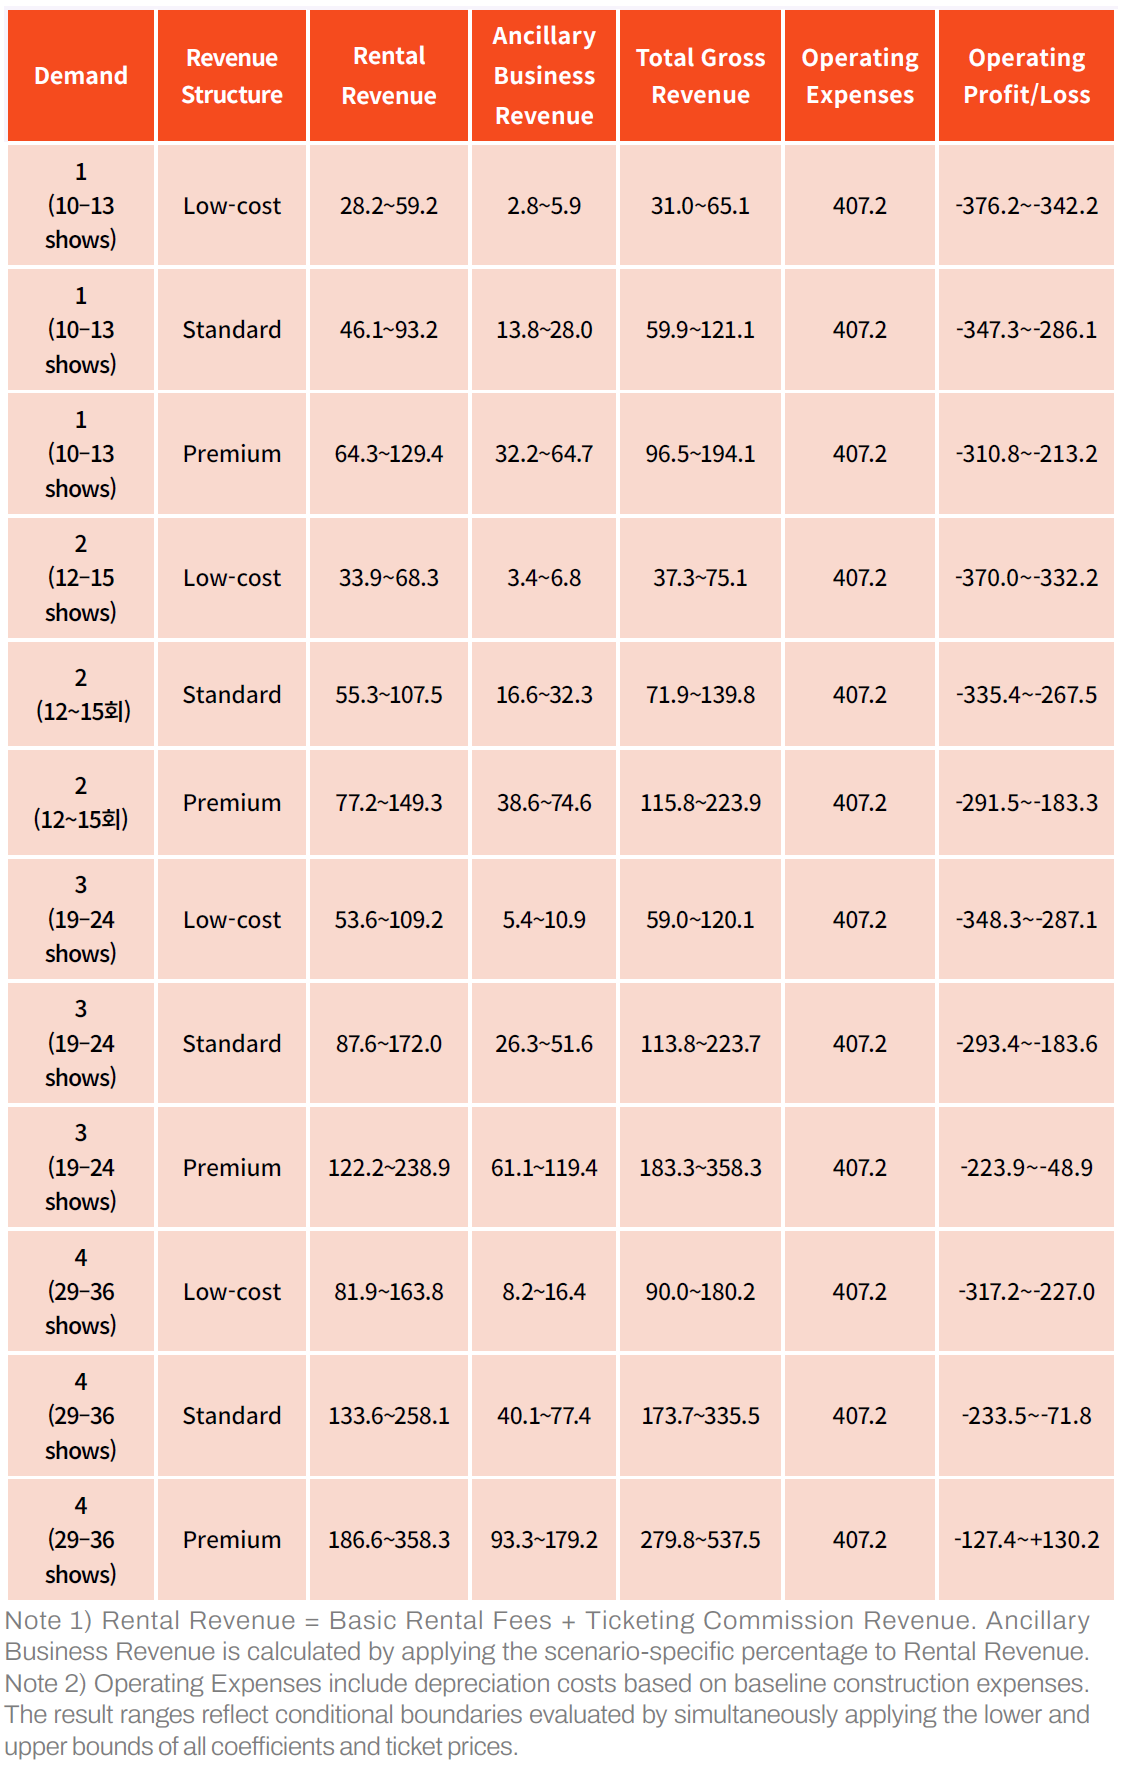
The analysis indicates that operating losses occur across the vast majority of scenario combinations. Scenario 1 (based on Goyang Stadium historical records) and Scenario 2 (expanding the scope of large-scale concert records) resulted in operating deficits under all three revenue structures. Scenario 3—which incorporates concerts with cumulative sales of 50,000 or more—showed a narrowing deficit at the upper bound of the Premium revenue structure, but failed to achieve profitability. Operating profitability was realized exclusively in the combination of Scenario 4 (expanding candidate targets to include concerts with cumulative sales of 30,000 or more) and the Premium revenue structure.
These findings demonstrate that achieving operational profitability requires simultaneously securing both a substantial volume of hosted performances and premium revenue conditions. Even under Scenario 4, which incorporates the broadest candidate demand scope, deficits persisted across all ranges up to the Standard revenue structure. Conversely, applying the Premium revenue structure failed to yield operating profits in Scenarios 1 through 3 due to restricted venue utilization. Within this model, neither expanding performance demand in isolation nor applying elevated pricing structures alone proved sufficient to fully cover annual operational expenses.
Examining the specific conditions required for profitability, the upper bound of Scenario 4 under the Premium revenue structure assumes an annual volume of 36 shows and 1.8 million tickets sold. Applying the Premium revenue structure parameters—higher basic rental fees, an average ticket price of 176,000 KRW, a ticketing commission rate of 10%, and an ancillary business revenue ratio of 50% relative to rental revenues—yields total annual gross revenue of approximately 53.7 billion KRW and an operating profit of approximately 13.0 billion KRW. However, this outcome materializes strictly under conditions where the demand realization coefficient, sellable seat ratio, and seat load factor all simultaneously reach 100%. Because the lower bound of this same combination results in an operating deficit of approximately 12.7 billion KRW, Scenario 4 under the Premium revenue structure should be interpreted as a potential threshold for profitability attainable under high ticket sales and favorable revenue conditions, rather than a guaranteed profitable scenario in itself.
분석 결과, 대부분의 조합에서 영업손실이 발생하였다. 고양종합운동장 실적을 기준으로 한 시나리오 1과 대규모 개최 실적을 확대한 시나리오 2는 모든 수익구조에서 적자를 보였다. 누적 판매량 5만 장 이상 공연을 추가한 시나리오 3도 프리미엄 수익구조의 상한에서 손실 폭이 줄어들었으나 흑자로 전환되지는 않았다. 흑자가 가능한 범위는 누적 판매량 3만 장 이상 공연까지 포함한 시나리오 4와 프리미엄 수익구조의 조합에서 나타났다.
이러한 결과는 공연 유치 규모와 수익조건을 함께 확보해야 운영 흑자가 가능함을 보여준다. 후보 공연을 가장 넓게 포함한 시나리오 4에서도 표준 수익구조까지는 분석범위 전체에서 적자가 발생하였다. 반대로 프리미엄 수익구조를 적용하더라도 공연 유치 범위가 제한되는 시나리오 1~3에서는 흑자에 도달하지 못하였다. 본 모형에서는 공연 수요의 확대나 높은 요금 조건 중 어느 하나만으로 운영비를 충당하기 어려운 것으로 나타났다.
흑자가 가능한 조건을 구체적으로 살펴보면, 시나리오 4·프리미엄의 상한은 연간 36회 공연과 180만 장의 티켓판매를 전제로 한다. 여기에 프리미엄 수익구조의 대관료, 평균 티켓가격 17만 6,000원, 관람권 수수료율 10%, 대관매출 대비 부대사업수입률 50%를 적용하면 연간 총수입은 약 537억 원, 영업이익은 약 130억 원으로 산정된다. 다만 이는 수요실현계수·판매 가능 좌석 비율·판매율이 모두 100%에 도달하는 조건이다. 동일한 조합의 하한에서는 약 127억 원의 손실이 발생하므로, 시나리오4·프리미엄 자체를 흑자 시나리오로 단정하기보다는 높은 판매 실적과 수익조건이 충족될 때 흑자가 가능한 경우로 해석해야 한다.
[Table 11] Annual Operating Profit and Loss by Demand and Revenue Structure Scenario (Unit: 100 Million KRW)
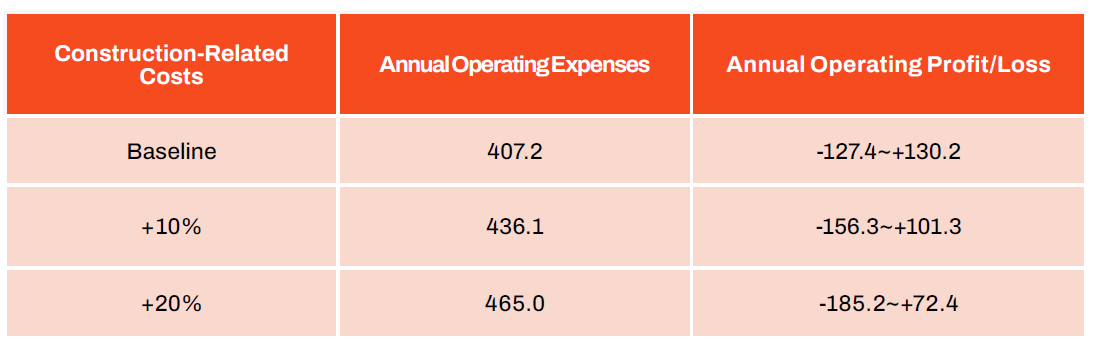
The impact of construction-related cost increases was also evaluated. Holding revenue parameters constant, an increase in construction-related costs elevates maintenance/repair expenses and depreciation costs, thereby deteriorating operational profit and loss. Personnel expenses, outsourced service fees, utility expenses, and other administrative expenses were assumed to remain constant.
When construction-related costs increase by 10% and 20%, annual operating profit/loss declines by approximately 2.9 billion KRW and 5.8 billion KRW, respectively. Under the upper bound of Scenario 4 with the Premium revenue structure, operational profitability is maintained even after accounting for these cost increases; however, the net profit margin narrows while lower-bound operating deficits expand. This demonstrates that cost management during the construction phase exerts a continuous, long-term impact on post-opening operational profitability.
However, the number of show runs in this analysis represents an aggregated figure converted from candidate performance records, rather than a empirically verified schedule feasibility for individual artists. Furthermore, the rate structures and ancillary business revenue ratios under the Premium revenue model serve as analytical assumptions rather than empirical figures validated through actual venue contracts. Because ancillary business revenue is modeled to scale proportionally with rental revenue, verifying specific business models and contract terms capable of securing such income streams remains essential. If additional operating expenses arising from increased show frequencies and expanded ancillary operations are not fully captured, operating income may be overestimated; therefore, actual operational planning requires a comprehensive evaluation of performance attraction feasibility, pricing/revenue structures, and incremental operating costs.
[Table 12] Construction Cost Sensitivity for Demand Scenario 4 under Premium Revenue Structure (Unit: 100 Million KRW)
Comprehensive Financial Feasibility Assessment
Building upon the annual operational profit and loss evaluated in the preceding chapter, this chapter evaluates the investment feasibility of constructing a 50,000-seat performance venue by converting cash flows across the entire project lifecycle into present value. Even if annual operations yield a profit, whether the magnitude of that profit is sufficient relative to initial investment expenditures at the established discount rate remains a separate question. Accordingly, this assessment comparative analyzes three investment structures: (1) direct private land acquisition, (2) public land provision, and (3) public land provision combined with partial construction subsidies, examining the precise conditions required to secure financial viability.
Analytical Methodology
Financial feasibility was evaluated based on Net Present Value (NPV) and Internal Rate of Return (IRR).4 The evaluation period was set to a total of 33 years, comprising a 3-year construction period (2027–2029) and a 30-year operational period (2030–2059). Construction-related capital expenditures were assumed to be deployed evenly across the construction phase, while land acquisition costs under the direct private purchase model were assumed to be fully disbursed in 2027.
Operating cash flows were calculated by deducting cash operating expenses from total annual gross revenue. Depreciation expenses were excluded from this calculation because they do not represent actual cash outflows and are already captured in the initial construction capital expenditures. Public construction subsidies were incorporated as a mechanism to reduce the private sector's initial investment burden, under the assumption that the provision of subsidies does not alter the venue's operating revenues or operating expenses.
All pricing benchmarks were standardized to 2027 constant prices. Specifically, operating revenues reflect 2030 prices under the assumption that nominal ticket prices observed in the market in 2026 will persist through the opening year, while operating expenses represent values adjusted to 2030 price levels. Projected operating revenues and cash operating expenses calculated for the opening year (2030) were converted into 2027 constant prices by assuming an annual inflation rate of 2.0%, referenced from the Bank of Korea's inflation targeting framework (2.0% per annum). Accordingly, 2030 operating cash flows were converted into 2027 real cash flows by dividing them by the inflation discount factor, (1.02)3, with real cash flows assumed to remain constant throughout the remaining operating period.
Meanwhile, initial investment expenditures were applied inclusive of Value-Added Tax (VAT), consistent with [Table 3]. That is, the baseline scenario adopts a conservative approach assuming the developer cannot claim input VAT refunds. If input VAT refunds prove eligible under actual future project structuring and tax treatments, initial cash outflows would decrease, thereby improving both IRR and NPV—a matter requiring separate sensitivity analysis. Cash flows in this analysis represent pre-tax project cash flows; consequently, the derived IRR corresponds to a pre-tax project IRR. These results should not be directly compared against equity returns that reflect debt financing structures and post-tax cash flows, but rather interpreted as a project-level evaluation assessing the intrinsic cash-generating capability of the asset itself. Furthermore, this model does not incorporate specific capital structure details such as debt ratios, interest expenses, or financing fees.
Discount rates were established as a sensitivity analysis range with reference to return metrics from domestic public-private partnership (PPP) projects and the inherent risks and uncertainties of venue development. Because this study evaluates the cost-recovery potential of private capital investments, benchmarks reflecting project risk and private investment decision-making criteria were deemed more appropriate than discount rates incorporating broader social benefits. In referenced domestic research analyzing revenue-type PPP projects, 162 projects across roads, railways, ports, and environmental facilities contracted between 1997 and 2014 demonstrated an average real, post-tax concession rate of return of 6.47%. However, because this 6.47% figure represents a real, post-tax concession rate, it is not directly comparable to this study's real, pre-tax project cash flows and was utilized solely as a contextual benchmark to gauge discount rate levels. Additionally, the Seoul Public Investment Management Center's Negotiation Guidelines for Cultural Facility PPP Projects notes that design and operational risks for cultural facilities can be higher than those for transportation infrastructure (roads and railways). Reflecting these additional risks and uncertainties, a real discount rate range of 7% to 10% per annum was established for sensitivity testing. The 7% lower bound was set above the referenced benchmark return, while the 10% upper bound evaluates conditions requiring higher returns due to the elevated uncertainty of performance venue operations. Thus, the 7–10% range serves as an analytical parameter for sensitivity testing rather than an estimated Weighted Average Cost of Capital (WACC) or fixed required rate of return.
Finally, under the direct private land acquisition model, land remains an asset even after the 30-year operational period concludes. Similar to treating buildings with a 30-year useful life and zero residual value, this model does not reflect terminal value for land. Even assuming the real value of the land is preserved, the present value of the land at the end of the analysis period (approx. 1.2072 trillion KRW) amounts to only approximately 129.5 billion KRW at a 7% discount rate and 52.0 billion KRW at a 10% discount rate. Consequently, incorporating land terminal value would not shift the Net Present Value (NPV) of the direct private purchase model into positive territory.
Financial Feasibility by Site Acquisition Model
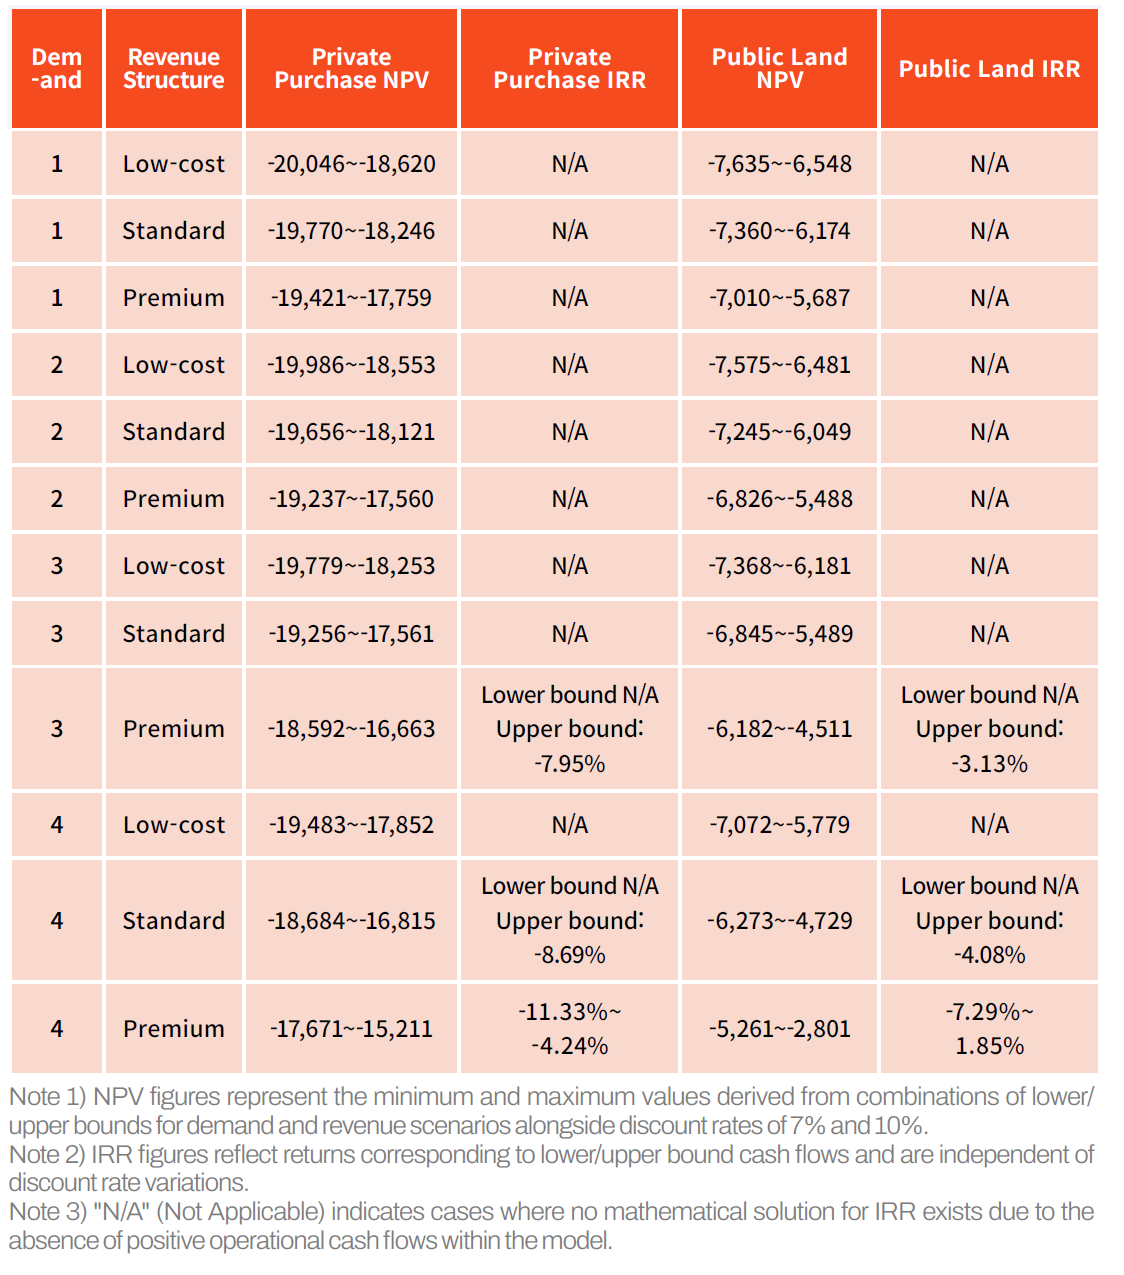
Under the direct private land acquisition model, an initial capital expenditure burden of approximately 1.9890 trillion KRW is incurred at baseline construction costs. Analysis indicates that Net Present Value (NPV) remains negative across all 12 combinations of demand scenarios and revenue structures. Even under the most favorable combination—Scenario 4 paired with the Premium revenue structure—NPV ranges between approximately −1.7671 trillion KRW and −1.5211 trillion KRW, with an Internal Rate of Return (IRR) calculated between approximately −11.33% and −4.24%.
This reveals a substantial disconnect between the initial investment required to acquire large-scale real estate in Seoul and the cash flows generated from venue operations. However, this shortfall cannot be attributed solely to land acquisition costs. Because operational revenues themselves fall short across numerous scenario combinations as demonstrated previously, the outcome should be interpreted as the combined effect of heavy initial investment burdens and structural limits on operational earnings.
When the public sector provides the site, the private sector's initial investment burden decreases to approximately 661.1 billion KRW, including contingency reserves. Nevertheless, NPV remains negative across all 12 combinations under this structure as well. For Scenario 4 under the Premium revenue model, NPV ranges between approximately −526.1 billion KRW and −280.1 billion KRW, with an IRR between approximately −7.29% and 1.85%. Although the IRR reaches positive territory at the upper bound, it falls far short of the 7% lower bound discount rate established in this study; thus, it cannot be deemed financially feasible.
[Table 13] Financial Feasibility by Site Acquisition Model (Baseline Construction Cost, NPV: 100 Million KRW)
Impacts of Public Construction Subsidies
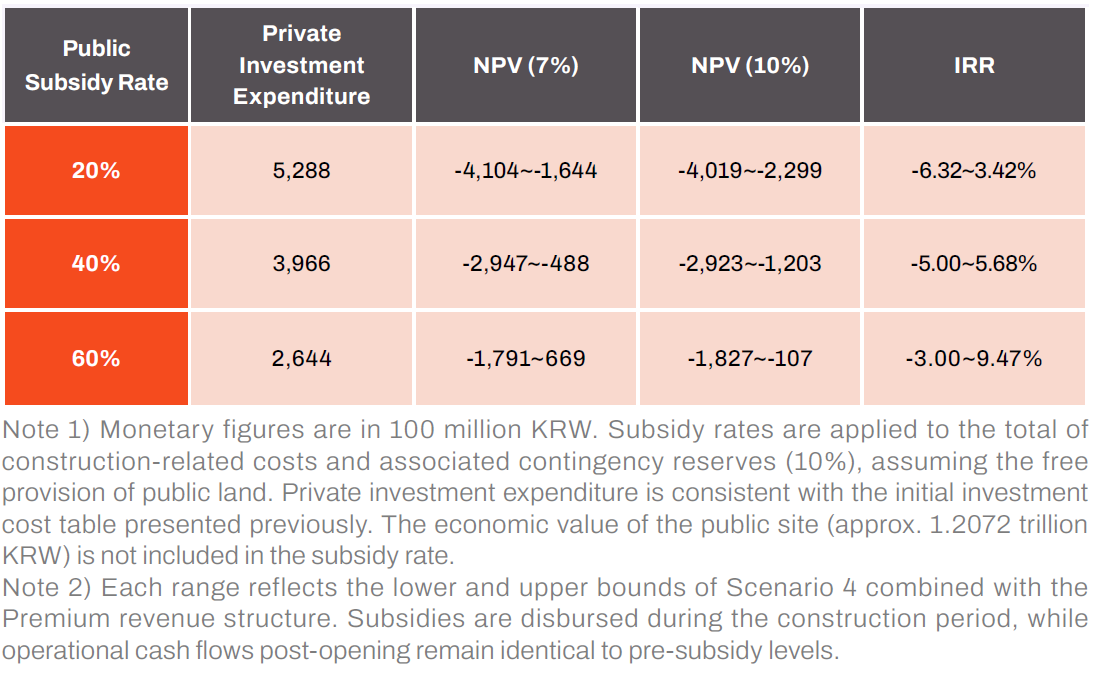
Recognizing that the provision of public land alone fails to secure financial viability, scenarios incorporating additional public construction subsidies equal to 20%, 40%, and 60% of total construction-related capital expenditures were evaluated. Eligible subsidy items encompass construction-related expenses and associated contingency reserves, with disbursements assumed to match capital expenditure outlay schedules over the construction period. The results presented below reflect the combination of Scenario 4 and the Premium revenue structure—the setup demonstrating the highest operational profitability potential.
Under baseline construction costs, subsidy rates of 20% and 40% failed to satisfy the required 7–10% discount rate threshold even under the most favorable demand and revenue parameters. Under a 60% subsidy rate, the upper-bound condition of Scenario 4 paired with the Premium revenue model yielded an IRR of approximately 9.47%. Consequently, Net Present Value (NPV) shifted into positive territory at approximately 66.9 billion KRW at a 7% discount rate, while remaining slightly negative at approximately −10.7 billion KRW at a 10% discount rate. Thus, a 60% subsidy represents a threshold boundary condition where viability hinges on the applied discount rate. Based on this model's upper-bound parameters, arithmetically satisfying the 10% discount rate threshold requires a subsidy rate of approximately 62% or higher, or an annual total gross revenue approximately 3% higher than the upper-bound projection.
However, this result is contingent upon the upper-bound condition simultaneously achieving 36 annual shows, 1.8 million tickets sold, and Premium revenue structure parameters. Because the lower bound of the same demand and revenue structure continues to yield a substantial negative NPV, a 60% subsidy alone should not be interpreted as a guarantee of commercial viability. Along with subsidy scale, the operational feasibility of performance attraction, ticket sales performance, and premium revenue terms must be rigorously verified.
While public construction subsidies reduce the private sector's initial capital outlay, they neither increase venue revenues nor lower ongoing facility maintenance expenses. Therefore, securing overall investment viability requires a combination of public financial support and robust execution in performance attraction, ticket sales, and ancillary revenue generation.
[Table 14] Financial Performance by Public Construction Subsidy Rate (Scenario 4 & Premium Revenue Structure, Baseline Construction Cost, Unit: 100 Million KRW)
Stress Testing the Most Favorable Scenario
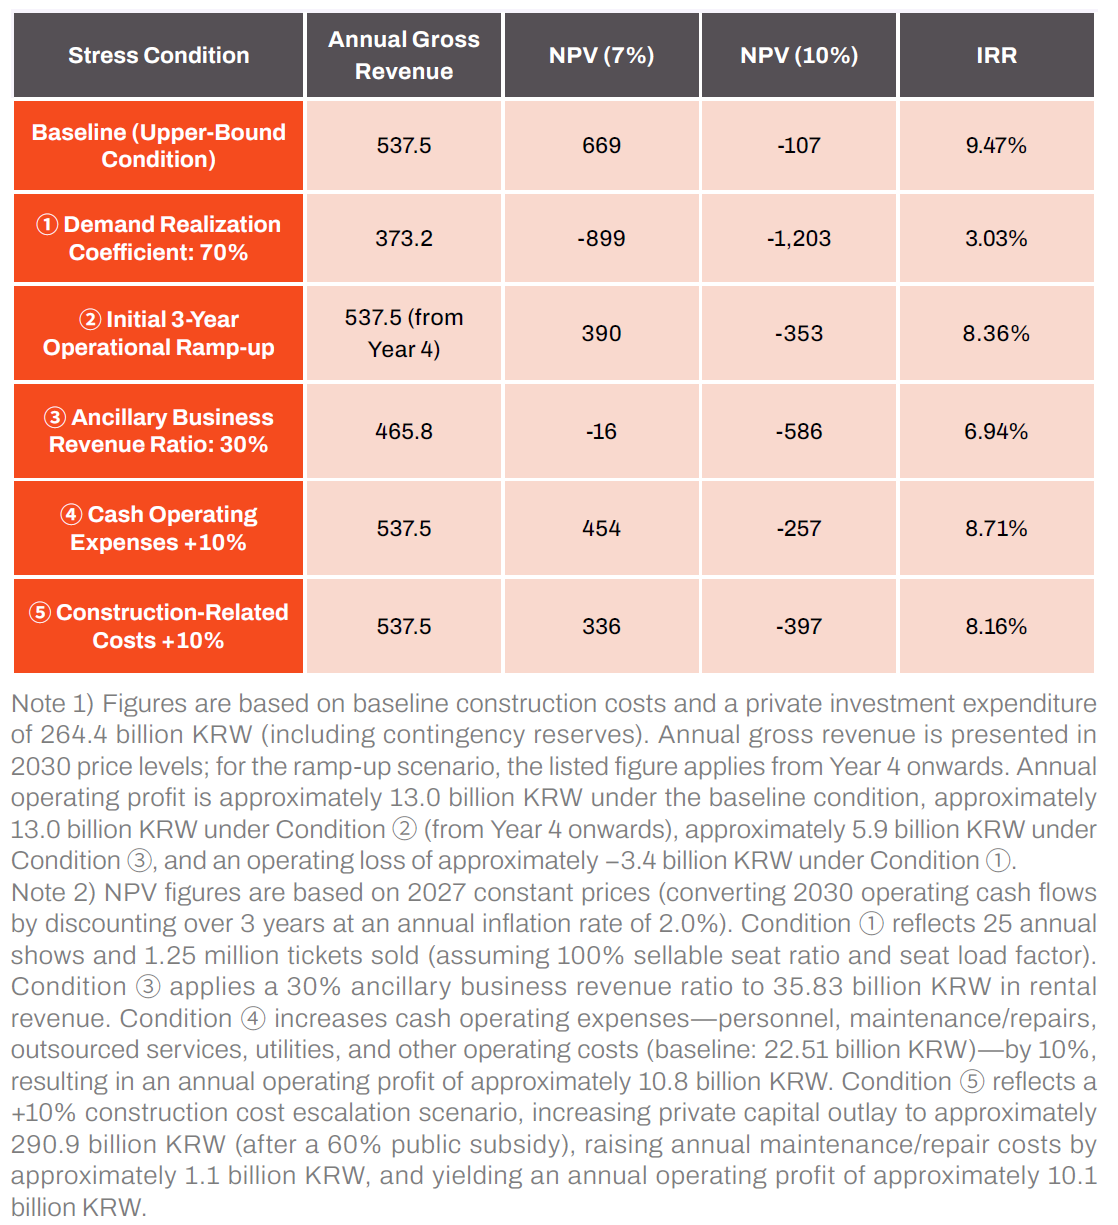
The previously evaluated 60% construction subsidy outcome reflects highly optimistic parameters: a 100% demand realization coefficient, a 100% sellable seat ratio, a 100% seat load factor, 1.8 million tickets sold, an average ticket price of 176,000 KRW, a 10% ticketing commission rate, and a 50% ancillary business revenue ratio simultaneously materializing. To test the robustness of this condition, five additional stress tests were conducted under the premise of free public land provision and a 60% construction subsidy.
First, the demand realization coefficient was reduced to 70% (yielding 25 annual shows and 1.25 million tickets sold). Second, an operational ramp-up period was assumed over the first 3 post-opening years—where venue attraction and ancillary operations mature incrementally—with total gross revenues starting at 60%, 75%, and 90% of the upper-bound level before reaching full capacity in Year 4. Third, the ancillary business revenue ratio under the Premium revenue structure was lowered from 50% to the Standard level of 30%. Fourth, cash operating expenses were assumed to increase by 10% relative to the baseline due to elevated venue utilization driving up utility, security, sanitation, and facility wear-and-tear costs. Fifth, construction-related costs were assumed to increase by 10% relative to the baseline, thereby increasing both post-subsidy private investment expenditures and ongoing maintenance/repair expenses. All other parameters were held constant at their upper-bound levels.
Analysis indicates that across all five relaxed conditions, the Internal Rate of Return (IRR) failed to reach the 10% upper-bound discount rate threshold, and fell below the 7% lower-bound threshold under the reduced demand realization coefficient and lower ancillary revenue ratio conditions. When the demand realization coefficient drops to 70%, annual operating profit/loss shifts into a deficit, and the IRR falls to approximately 3%. Incorporating an initial operational ramp-up alone expands the Net Present Value deficit at a 10% discount rate, NPV (10%), by more than three times, while lowering the ancillary business revenue ratio to the Standard level reduces NPV at a 7% discount rate, NPV (7%), to near zero. A 10% increase in cash operating expenses reduces annual operating profit to approximately 10.8 billion KRW, lowering the IRR to approximately 8.71% and more than doubling the NPV (10%) loss to approximately −25.7 billion KRW. Furthermore, a 10% increase in construction costs elevates private capital expenditures to approximately 290.9 billion KRW, pushing the IRR down to approximately 8.16%. These findings demonstrate that even the maximum support level evaluated in this study—public land provision combined with a 60% construction subsidy—does not constitute a sufficient condition for financial feasibility, as underperformance in any single area (performance attraction, ticket sales, or ancillary revenue generation) can dismantle overall investment viability.
Conversely, higher operational revenues or lower expenditures could enable project feasibility under lower subsidy rates, highlighting that the fundamental core lies in simultaneously achieving initial capital relief and strong operational performance rather than the 60% figure itself. Therefore, actual project implementation requires designing risk-mitigation mechanisms—such as initial loss-sharing frameworks during the ramp-up period, contractual guarantees for ancillary business revenues, and advance performance booking commitments—alongside public financial support.
[Table 15] Stress Test Results for the Most Favorable Scenario (Scenario 4 & Premium Revenue Structure, Public Land + 60% Construction Subsidy, Unit: 100 Million KRW)
Policy Agenda for Large-Scale Venue Construction and Sustainable Operation
Among the 12 demand and revenue structure combinations evaluated, direct private land acquisition or public land provision alone failed to secure financial viability under the applied discount rates. However, combining public land provision with construction-related capital investment subsidies enabled Net Present Value (NPV) to shift into positive territory at a 7% discount rate under the most favorable operational conditions. This does not imply that performance venue construction is automatically profitable, but rather demonstrates that financial feasibility requires a balanced capital structure—one that reduces initial investment burdens alongside robust performance attraction/sales records and high ancillary business revenues. Translating these conditions into practice requires simultaneously evaluating how, where, and under what operational model the venue will be developed. This study proposes the following strategic directions centered on the dual pillars of development and operations.
Overcoming Initial Entry Barriers and Strengthening Execution through Public-Private Partnerships
In the financial feasibility assessment, the direct private land acquisition model yielded negative NPVs across all defined conditions, while public land provision alone proved insufficient to achieve investment viability under the 7–10% discount rate benchmark applied in this study. Conversely, pairing public land provision with partial construction subsidies secured financial feasibility under the most favorable operating parameters. This highlights that constructing a large-scale performance venue requires addressing initial investment cost-sharing structures alongside performance demand and operational revenues. However, public subsidies merely mitigate private capital burdens and do not automatically compensate for operational revenue deficits. Consequently, subsidy scale must be evaluated alongside rigorous verification of private-sector performance attraction capabilities and ancillary commercial plans—a role-sharing framework effectively implemented through Public-Private Partnerships (PPP)
.
Because a venue's success depends on event curation and revenue structure design, a user-fee-based PPP model—such as Build-Transfer-Operate (BTO), where the public sector retains facility ownership while the private partner operates the venue for a set concession period to recover capital through user fee revenues—serves as a primary alternative under the revenue-centric operational framework assumed in this study. However, because this analysis primarily compared initial capital-sharing parameters, project-specific variations—such as debt-to-equity ratios, financing costs, concession periods, minimum revenue guarantees (MRG), and government availability payments—were not explicitly modeled. Therefore, the suitability of any specific PPP delivery model must be determined through a dedicated comparative PPP feasibility study that delineates operational terms, ancillary business scopes, demand risk allocation, and facility maintenance obligations.
International precedents demonstrate that such public-private risk sharing is not uncommon. The Kai Tak Sports Park in Hong Kong, which opened in March 2025, adopted a framework where the government financed the entire construction cost of approximately 30 billion HKD, while a private consortium assumed Design-Build-Operate (DBO) responsibilities—bearing operational costs over a 25-year contract term in exchange for paying the government 3% of gross revenues plus a fixed payment. This case illustrates a public-private functional division where the public sector absorbs initial construction outlays while the private sector assumes operational accountability, aligning directly with this study's finding on the critical importance of sharing initial investment burdens.
Meanwhile, regarding the 50,000-seat national landmark performance venue plan announced by the government in 2026, certain media reports have cited a total project cost of approximately 1 trillion KRW with central government subsidy support of around 20–30%.5 This figure reflects media coverage during initial review stages rather than an officially confirmed subsidy allocation. In this study, combining free public land provision with a 60% construction-related capital subsidy shifted NPV into positive territory at a 7% discount rate under the most favorable operating parameters, though it fell slightly short at a 10% discount rate. However, central government subsidies cited in media reports and the construction-related investment subsidies modeled in this study differ in funding entities and calculation baselines, precluding direct comparison. Actual project execution requires evaluating capital-sharing structures by converting national funds, local government contributions, the economic value of public land, and private capital outlays into a unified total project cost baseline.
To address initial operational demand uncertainties after opening, risk-and-reward sharing mechanisms—where the public and private sectors jointly share deficits and excess profits—can also be evaluated. However, this represents a parameter distinct from the construction subsidies analyzed previously and may entail additional public fiscal obligations. If risk-sharing frameworks are implemented, subsidy caps, application periods, private sector accountability, and performance evaluation benchmarks must be clearly defined upfront. Concession agreements must be rigorously structured to ensure public support does not weaken private operational efficiency incentives or degenerate into long-term deficit absorption.
Finally, public and private roles must be clearly delineated. The public sector must evaluate the necessity and scope of land provision and construction subsidies while establishing linkages with transportation and urban planning alongside public-interest safeguards. Converting or retrofitting existing public sports facilities with favorable accessibility and utilization conditions presents a viable alternative. However, because the cost and feasibility analyses in this study assume new construction, potential cost savings and operational feasibility associated with facility repurposing require separate evaluation.
The private sector must enhance the efficiency of venue staging and facility operations through professional design and construction expertise, while securing stable performance bookings by fostering strategic partnerships with domestic and international promoters. In particular, given that ancillary business revenues emerged as a critical variable governing operational profitability in this study, the private operator must detail and validate diverse income streams, including naming rights, commercial space leasing, concessions/merchandise sales commissions, and advertising. In doing so, financial projections must present not only revenue targets but also corresponding capital expenditure requirements, incremental operating costs, and contractual terms to verify the actual realizability of projected earnings.
To execute this effectively, a consultative body comprising relevant government ministries, local municipalities, and private sector experts should be established to coordinate site selection, financial burden-sharing, and private partner selection procedures. In the competitive bidding process for private concessionaires, evaluation criteria must comprehensively assess operational track records and expertise in concert promotion, ancillary commercial development plans, financing capabilities, and public contribution commitments alongside architectural design and construction capabilities. Transparently disclosing evaluation benchmarks prior to bidding—and systematically monitoring investment execution and operational performance against concession agreements post-selection—will be essential to securing transparency and institutional accountability throughout project implementation.
Strategic Site Selection: Prioritizing Total Value Creation over Land Cost
Selecting a venue site is not merely a process of securing real estate; it represents a strategic choice that fundamentally determines demand and operational profitability. A large-scale performance venue functions simultaneously as a destination facility, a high-capacity transit node facilitating the rapid movement of tens of thousands of visitors, and a tourism hub driving accommodation, dining, and retail consumption. Consequently, selecting an outlying location purely due to cheap land prices can induce transit friction and demand erosion that far exceed initial real estate savings. Accordingly, this study proposes four primary criteria for site evaluation
First, the location must possess a thoroughly verified demand catchment area. The financial viability of a performance venue hinges on its ability to consistently attract a minimum volume of major show runs each year. As demonstrated in earlier chapters, demand for large-scale concerts is overwhelmingly concentrated within the Seoul Metropolitan Area (SMA); while key facilities in the capital region operate near capacity limits, hosting track records at non-SMA venues remain strikingly minimal. Because sites lacking robust regional demand cannot guarantee financial sustainability regardless of other favorable parameters, locations with proven demand must be prioritized. The government's decision to locate the 50,000-seat national landmark venue within the SMA aligns directly with this empirical demand distribution.
Second, public transit and airport accessibility must be fully secured. Transit infrastructure must provide sufficient throughput capacity to disperse 50,000 attendees rapidly upon concert conclusion, prioritizing sites offering direct integration or seamless pedestrian connections with existing mass transit lines (subways and buses). Transfer-heavy transit routes or reliance on secondary transportation modes heighten visitor friction, eroding the venue's competitive edge in concert booking. Furthermore, given the global fandom of K-pop and incoming international audience demand, airport proximity and scale serve as essential conditions. Securing accessibility that allows fans from Japan, China, the United States, and beyond to attend shows conveniently enables the venue to transcend domestic demand and operate as a global concert hub.
Third, surrounding accommodation and commercial infrastructure must be established. The site must be backed by a mature commercial ecosystem featuring abundant lodging, food and beverage (F&B), and retail amenities. When attendees can dine, shop, and stay in the immediate vicinity before and after events, fan visits transition from single-instance concert attendance into multi-day stayover tourism, multiplying economic spillover effects across regional hotel, dining, and retail sectors. Sites lacking adequate lodging and commercial infrastructure fail to retain visitor spending within the local economy, causing economic benefits to disperse externally while capping the venue's internal ancillary business revenues.
Fourth, noise risk must be manageable. Because large-scale concerts primarily take place during evening hours, failing to secure adequate buffer distances from high-density residential areas can lead to severe operational constraints post-opening. In practice, several existing venues face restricted show hours or demands for additional noise-mitigation installations due to ongoing resident complaints. If noise issues neglected during site selection end up restricting annual show frequencies during actual operations, the underlying financial model can be severely undermined.
These evaluation criteria do not operate in isolation but are deeply interconnected. Catchment demand establishes the foundation for event booking, transit/airport accessibility converts potential demand into actual attendance, and local commercial/lodging infrastructure transforms concert visits into extended tourism—maximizing economic spillovers. Therefore, site selection must be determined through a comprehensive evaluation framework integrating validated demand and multi-modal accessibility, rather than relying on isolated advantages in a single dimension.
Expanding Ancillary Revenues and Regional Economic Spillovers through K-Culture Integration
The strategic value of a major performance venue expands exponentially when its direct operational revenues generate broader spillover effects for surrounding industries and city branding. A venue is not a self-contained tourist attraction in itself, but rather an "anchor asset" drawing fans into a city. If this anchor is not integrated with local lodging, experiential activities, shopping, and transportation, visitor attendance fails to convert into regional stays and sustained consumption, leaving the host city with disproportionate external costs such as traffic congestion. Therefore, an integrated "K-Culture Ecosystem"—seamlessly linking performance, experience, accommodation, and retail pathways—must be systematically cultivated.
This integration directly influences not only non-financial economic impacts but also the venue operator's bottom-line ancillary earnings. As demonstrated in the earlier stress testing—where reducing the ancillary business revenue ratio from 50% to 30% pushed the IRR under the most favorable scenario down from 9.5% to 6.9%—securing ancillary revenues represents a critical determinant of financial feasibility, with cross-sectoral integration serving as a primary mechanism to expand these revenue streams. Consequently, the venue operator must establish long-term partnerships with domestic and international promoters well prior to opening to secure initial booking pipelines, while detailing ancillary business lines such as naming rights, corporate sponsorships, permanent F&B/merchandise retail hubs, and premium VIP lounges. During off-peak concert seasons, non-performance calendar days should be monetized through alternative programming, including corporate events, international conventions, and e-sports tournaments.
External coordination beyond the venue gates requires joint design by municipal governments, tourism boards, and the hospitality sector. Services tailored for international visitors—combining airport-to-venue transit, lodging packages, multi-lingual guidance, and post-event late-night transportation—should be established alongside data-sharing frameworks analyzing audience demographics and spending habits to drive extended tourism stays. In the long term, establishing dedicated cultural districts centered on the venue and integrating them with broader K-culture tourism routes can be evaluated; however, because these macroeconomic spillovers lie outside the scope of this financial study, their precise economic magnitude must be verified through separate benefit-cost assessments.
[Figure 3] Policy Agenda for Large-Scale Venue Construction and Sustainable Operation
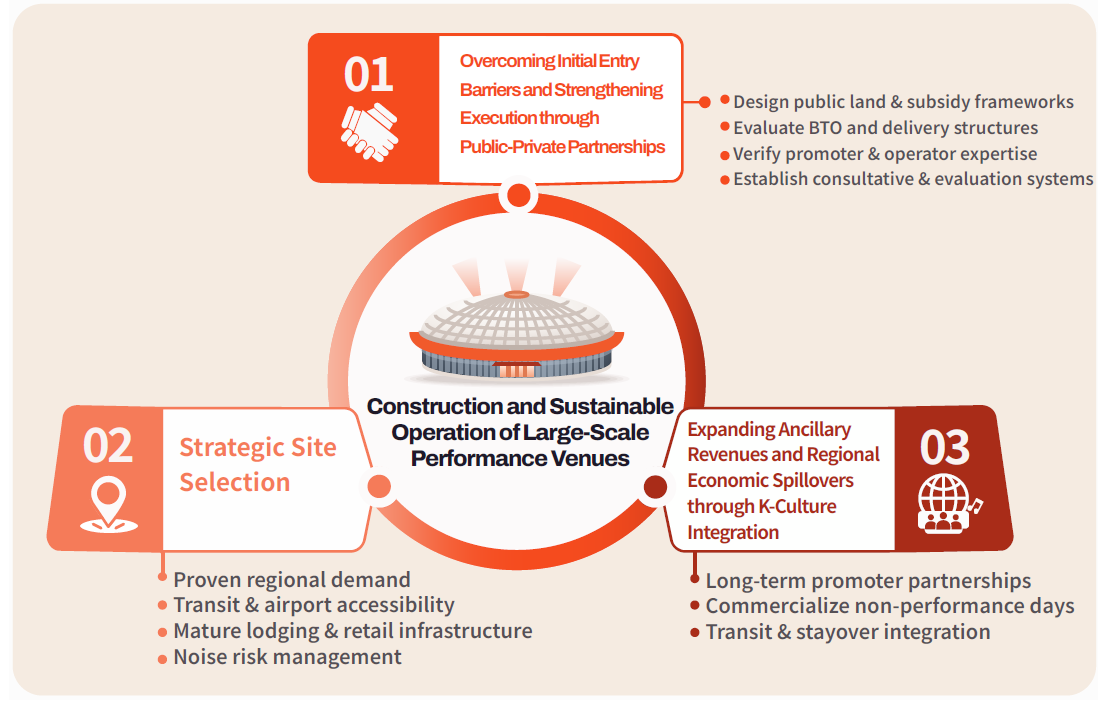
Conclusion: Prerequisites for Project Feasibility of a 50,000-Seat Venue
This study reveals that while the necessity of a 50,000-seat performance venue is widely recognized, commercial viability is by no means automatically guaranteed. Under most of the 12 evaluated combinations of demand, revenue, and cost structures, operational deficits emerge when accounting for depreciation costs. Furthermore, neither direct private land acquisition nor public land provision alone satisfies investment viability benchmarks under the applied 7–10% discount rate framework. However, under the most favorable operating parameters, pairing public land provision with a 60% construction-related capital investment subsidy enables Net Present Value (NPV) to shift into positive territory at a 7% discount rate. Assuming the economic value of public land equals the estimated real estate purchase price in this study, the public sector absorbs approximately 86% of the total economic cost burden when combining land value and construction subsidies. Nevertheless, under stress testing adjusting demand realization, initial ramp-up, ancillary business ratios, operating expenses, and construction cost escalations, Internal Rates of Return (IRR) decline to approximately 3.0–8.7%, failing to satisfy the 10% discount rate benchmark, while falling below the 7% threshold whenever demand or ancillary revenues underperform assumptions. Rather than yielding a binary conclusion on feasibility, these findings demonstrate that project viability hinges on extraordinarily stringent conditions requiring rigorous upfront verification of both initial capital structures and operational execution.
Enhancing project feasibility requires evaluating four key prerequisites simultaneously: First, reduce private initial investment burdens through public land utilization and construction cost-sharing, while independently verifying the necessity and caps of public support. Second, secure annual show booking pipelines in advance by establishing long-term strategic partnerships with domestic and international promoters. Third, structure diversified commercial revenue streams prior to opening, including naming rights, food and beverage (F&B), merchandise retail, premium VIP services, and tourism linkages. Fourth, select a site that comprehensively satisfies demand catchment, mass transit, lodging, commercial ecosystem, and noise mitigation conditions. Neglecting any single requirement weakens the efficacy of the remaining parameters. A large-scale performance venue must not be approached as a standalone real estate development, but as an integrated platform business synthesizing content, transportation, tourism, and commerce.
Central and local governments must determine "what demand will be sustained through what operational model" prior to deciding "how many seats to build." While 20,000- to 30,000-seat facilities relieve current supply bottlenecks, they face structural limits in fully absorbing massive demand generated by global megastars. Conversely, prioritizing a 50,000-seat scale without operational readiness risks severe fiscal burdens and underutilization. Therefore, candidate proposals must be evaluated against standardized benchmarks, adopting a "conditional decision-making" framework where project execution proceeds only after passing phased demand verification, traffic impact assessments, private operational plans, and ancillary revenue guarantee plans.
The public sector must clearly define the scope, availability, and performance conditions of land and infrastructure support, while the private partner assumes full operational accountability for event attraction and financial performance. If these framework conditions are meticulously designed and verified in phases, a 50,000-seat performance venue can serve as a vital foundation converting K-pop's cultural clout into tangible economic and tourism value. However, because national brand elevation and macroeconomic tourism spillovers lie outside the scope of this financial assessment, final implementation decisions must be evaluated alongside separate economic benefit estimation studies. In closing, we look forward to the day when the full economic fruits created by K-pop are fully realized and captured within South Korea.
 Prev
Prev  Back
Back