
Vol. 17 Forecast of Inbound Tourist Arrivals to South Korea in 2026
- Reg Date
- 2026.09.17


Forecast of Inbound Tourist Arrivals to South Korea in 2026
Executive Summary
- Yanolja Research has revised its forecast for inbound foreign visitors to Korea in 2026 to approximately 23.57 million. This represents a 24.5% increase compared to 2025 and is about 2.31 million higher than the upper limit of the forecast released in January of this year.
- This revision goes beyond a simple adjustment; it updates the outlook to reflect the reality that the inbound market has grown faster and more broadly than anticipated since the beginning of the year. From January to July 2026, foreign arrivals in Korea rose 21.3% year-over-year, with growth spreading not only to China, but also to Japan, Taiwan, the U.S., and other key markets.
- While the growth from China largely aligned with the destination reallocation scenarios assumed early in the year, the surprisingly stronger shift came from Japan and Taiwan, where the preference for choosing Korea increased significantly—a trend that subsequently spread to long-haul markets. Although market-specific drivers varied, expanding interest in K-culture served as a common foundation for demand, while travel conditions like airline capacity and foreign exchange rates supported actual visits.
- Reflecting these performance and demand indicators, the revised forecast for 2026 inbound foreign visitors stands at approximately 23.57 million. This estimate assumes that the recent trend of choosing Korea and favorable demand conditions will continue into the second half of the year. Key indicators to monitor moving forward include the proportion of travelers from Japan and Taiwan choosing Korea, the conversion of K-culture interest into actual visits, and conditions surrounding flight supply and exchange rates.
Changes in Korean Inbound Market Since the Initial Forecast
In its report entitled 「Forecasting South Korea's Inbound and Outbound Tourism Demand in 2026」 published in January 2026, Yanolja Research projected inbound foreign visitors for the year to be between 20.76 million and 21.26 million. This range added 400,000 to 900,000 visitors—based on a scenario where a portion of Chinese outbound demand shifted from Japan to Korea—to a baseline estimate of 20.36 million (which excluded the spillover effects of China-Japan conflict). The forecast was calculated on the assumption that the recovery trends observed through 2025, alongside market, airline, exchange rate, and international geopolitical conditions, would persist.
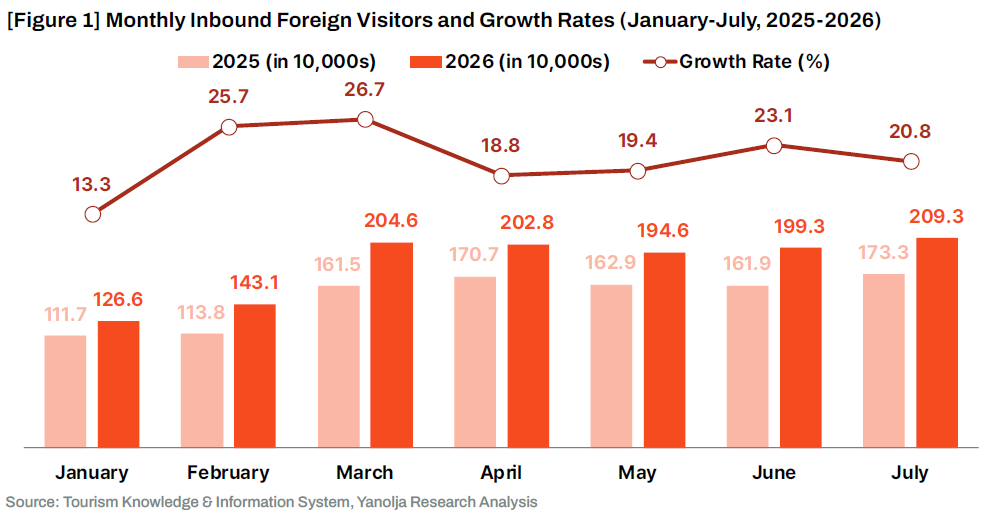
However, since early this year, the actual inbound market has evolved much faster than the growth trajectory assumed in the initial projection. From January to July 2026, foreign arrivals reached 12.803 million, an increase of 2.244 million (21.3%) compared to 10.559 million during the same period last year. Monthly growth rates accelerated from 13.3% in January to 25.7% in February and 26.7% in March, maintaining strong momentum between 18.8% and 23.1% from April to July. Arrivals in July reached 2.093 million, marking the highest monthly volume in the January–July period.
Even if only the currently observed trajectory continues, total arrivals are expected to surpass the upper limit of the early-year forecast. Specifically, if arrivals in the remaining five months (August to December) grow by just 10% year-over-year, the annual total would reach approximately 22 million, exceeding the upper bound of the January forecast (21.26 million). Therefore, the core question of this revised forecast is what drove the gap between the initial projection and the currently observed demand path, and what this change implies for future inbound demand. Accordingly, this brief first examines the distribution of growth through nationality-wise entry statistics, analyzes the background of strengthening preference for Korea across three layers—K-culture as a shared demand base, market-specific triggers, and converting conditions such as flight capacity and exchange rates—and presents the revised annual forecast.
Stronger-than-Expected Preference for Korea
Surging Growth in Japan and Taiwan and Market Expansion Drive Forecast Gap
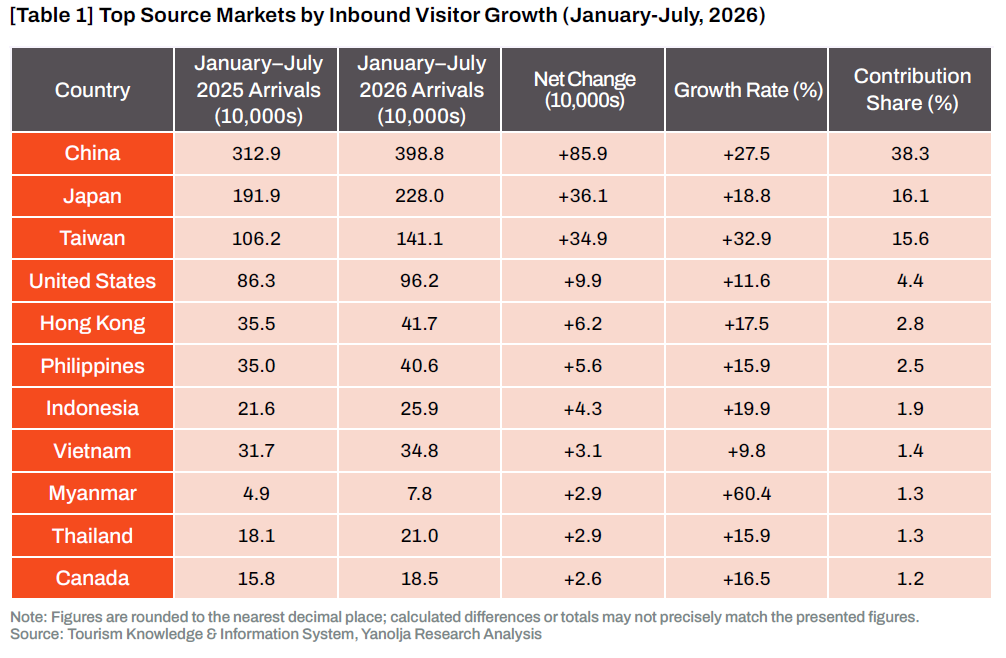
China, Japan, and Taiwan accounted for 70.0% of the 2.244 million year-over-year increase in inbound visitors to Korea between January and July 2026. China was the single largest contributor, drawing 3.988 million visitors—an increase of 859,000 year-over-year—and generating 38.3% of total growth. Japan added 361,000 visitors (16.1% of total growth), while Taiwan contributed 349,000 (15.6%). Notably, Taiwan posted the highest growth rate (32.9%) among the top four source markets. Including the U.S., which grew 11.6% to reach 962,000 visitors, the top four markets together generated 1.67 million additional visitors, accounting for 74.4% of overall growth.
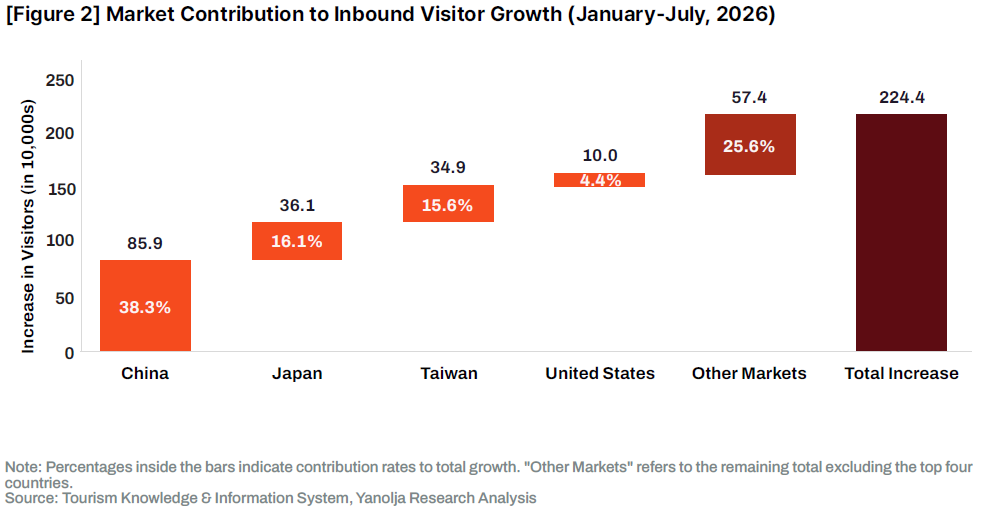
The remaining 25.6% (574,000 visitors) originated outside the top four markets, highlighting a broad geographic expansion. In Asia, visitor counts from Hong Kong and Philippines rose by 62,000 and 56,000, respectively, while Indonesia saw an increase of 43,000. Among long-haul markets, Canada grew by 26,000 visitors. The wide scope of this expansion is further reflected in entry statistics showing visitor increases from 53 out of 59 tracked countries.
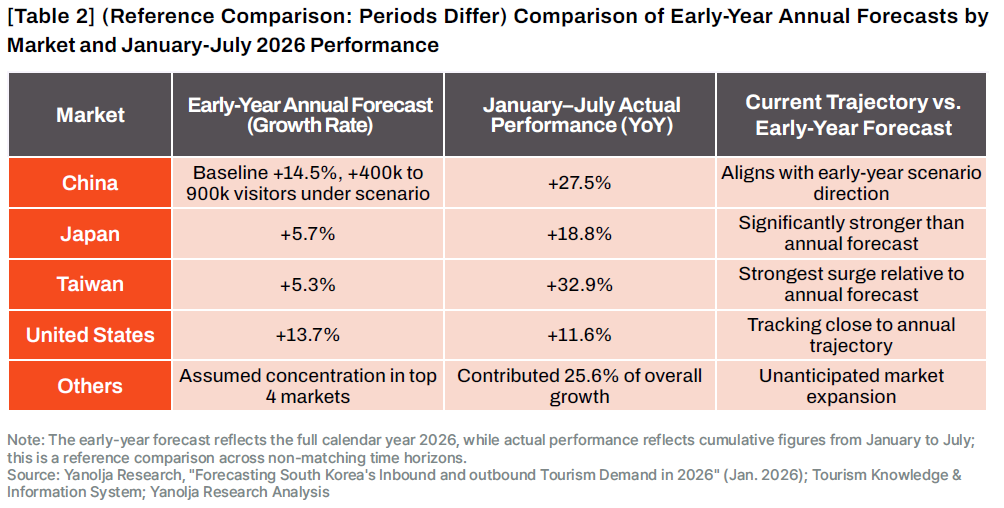
Although China generated the largest volume increase (+859,000 visitors from January–July), its growth aligns closely with the early-year scenario. The January forecast had already incorporated an annual spillover effect of 400,000 to 900,000 visitors driven by China-Japan conflict, making China’s current growth path fundamentally consistent with the destination reallocation scenario established early in the year. In contrast, while the baseline forecast had assumed modest full-year growth for Japan (+5.7%) and Taiwan (+5.3%), actual performance for the January–July period reached +18.8% and +32.9%, respectively. The U.S. is tracking close to its early-year annual trajectory (+13.7%), while markets outside the top four generated 25.6% of overall growth despite no significant expansion having been projected early in the year.
일본·대만: 해외여행 증가보다 훨씬 빨라진 한국행Japan & Taiwan: Growth in Travel to Korea Significantly Outpaces General Outbound Travel
Inbound visitors from Japan reached 2.280 million from January to July 2026, marking an increase of 361,000 visitors, or 18.8%, compared to the same period last year. During this timeframe, total Japanese outbound travel grew modestly by 4.1%—from 7.814 million in 2025 to 8.136 million in 2026. The growth rate of Japanese travel to Korea was more than four times higher than their overall outbound travel growth, demonstrating a rapid expansion of visits to Korea despite slow growth in overseas travel broadly.
Inbound visitors from Taiwan totaled 1.411 million between January and July 2026, representing an increase of 349,000 visitors, or 32.9%, year-over-year—the highest growth rate among the top four markets. According to the Ministry of Transportation and Communications of Taiwan, total Taiwanese outbound travel grew by 16.3%, from 10.874 million to 12.652 million during the January–July period. However, outbound trips specifically to Korea surged by 34.3%—from 1.027 million to 1.380 million—outstripping the overall outbound growth rate by 18.0 percentage points. Consequently, Korea’s share of total Taiwanese outbound travel rose from 9.4% to 10.9%.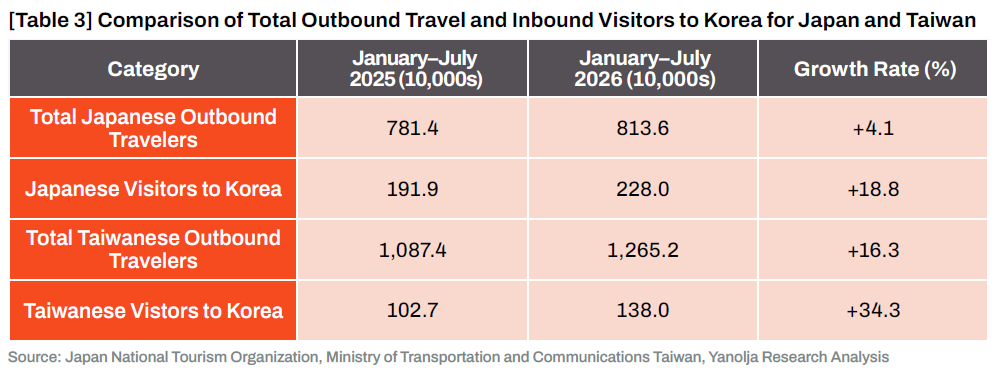
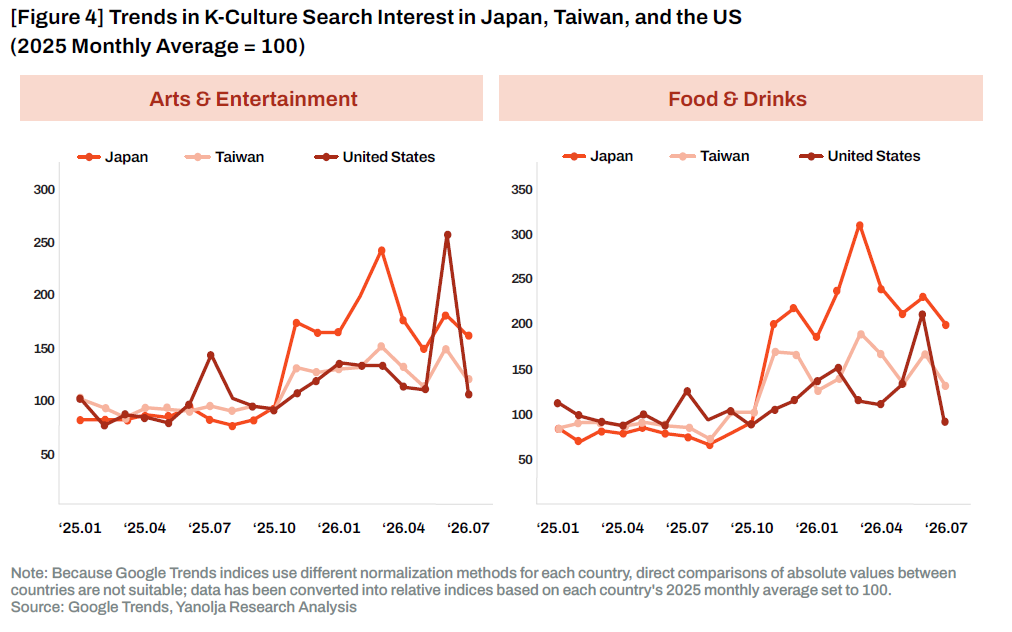
Behind this trend lies the widespread expansion of interest in Korean culture. According to Google Trends data for Japan in the "Arts & Entertainment" and "Food & Drink" categories, search indices for "Korea" jumped sharply in November 2025 and consistently exceeded year-ago levels through July 2026. The January–July averages rose by 116.0% and 198.3% respectively, marking the largest increases among all markets analyzed. Although flight frequencies from Japan to Korea increased by 19.4% during January–July, price conditions were unfavorable as the Korean Won depreciated against the Japanese Yen by 2.3%. The fact that arrivals grew by over 20% despite unfavorable foreign exchange conditions underscores that content engagement and accessibility are closely linked to choosing Korea over price factors.
In Taiwan, the rise in Korea's market share similarly coincided with expanding interest in Korean culture. The Arts & Entertainment search index jumped from 62 in October 2025 to 87 in November, while the Food & Drink index rose from 51 to 91. Between January and July 2026, these average indices were 38.7% and 69.8% higher year-over-year, respectively. Unlike Japan, Taiwan also benefited from favorable conditions across both flight supply and currency: flights on Korea–Taiwan routes grew by 21.6%, and the New Taiwan Dollar appreciated by 3.8%. Taiwan was the only market where all four driver factors—outbound travel sentiment, cultural interest, flight accessibility, and exchange rates—aligned positively.
The commonality between both markets is that growth isn't merely driven by a general rise in overseas travel, but by a rising preference for Korea among competing international destinations. This demonstrates a clear strengthening of Korea's relative destination competitiveness across key source markets in 2026.
China: Realization of Early-Year Scenarios and Destination Reallocation
China was the largest contributing market, accounting for 38.3% of total growth, with inbound visitors reaching 3.988 million—an increase of 859,000 (27.5%) compared to the same period last year. Aggregating statistics from 22 major destinations that report Chinese tourist arrivals shows that total outbound Chinese travelers reached 61.089 million between January and July 2026, up 4.7% year-over-year. The most dramatic shift occurred in Japan: Chinese visits to Japan dropped 56.3%—from 5.693 million to 2.487 million—representing a reduction of 3.207 million visitors. Meanwhile, trips to Korea grew from 3.129 million to 3.988 million over the same period, elevating Korea's share among the 22 aggregated destinations from 5.4% to 6.5%.
This divergence did not exist from the start. In September and October 2025, Chinese visitor numbers to both Korea and Japan were increasing at similar rates of 19% to 23% year-over-year. The trajectories split in November. Growth in Chinese travel to Japan slowed to 2.9% in November before plummeting by -45.3% in December, continuing to shrink by 45% to 61% each month in 2026. Conversely, trips to Korea maintained solid growth at 26.9% and 28.4% in November and December, respectively, and continued to sustain double-digit monthly growth rates throughout January to July 2026.
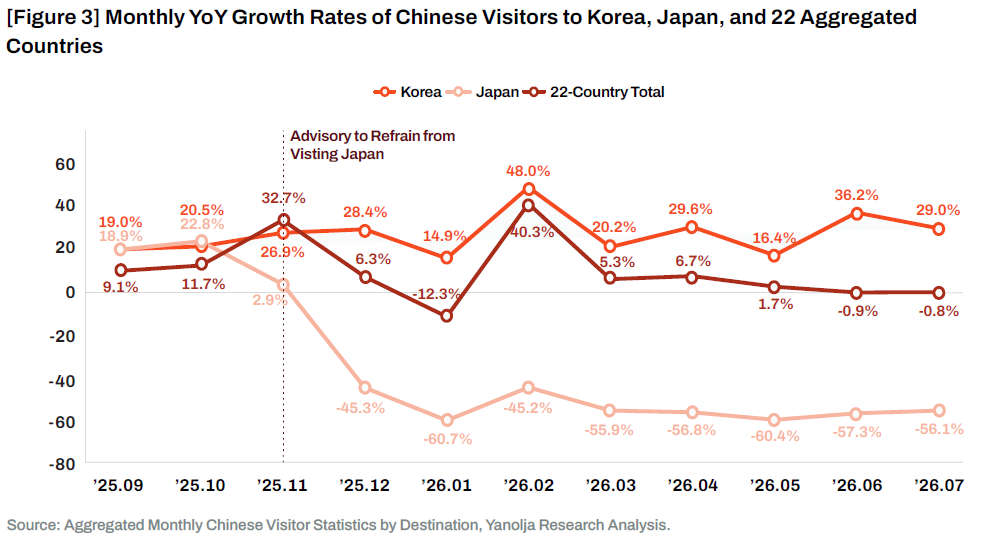
This inflection point coincided directly with deteriorating China-Japan conflict. In November 2025, the Chinese government cited remarks made by Japanese leadership regarding Taiwan, stating that the bilateral atmosphere for exchange had deteriorated, and advised its citizens to refrain from visiting Japan for the time being.1 As travel to Japan plummeted, visits to Korea continued to rise, suggesting that a portion of the demand originally destined for Japan reallocated to alternative destinations, with Korea benefiting from the spillover. Pricing conditions supported this trend, as the KRW/CNY average exchange rate rose 10.8% year-over-year. However, because Chinese travel to Korea was already expanding prior to the drop in Japanese arrivals, it would be inaccurate to attribute the entire 859,000 visitor increase solely to this spillover effect. As established, China's current growth trajectory is best understood as aligning with the direction of the scenario established early in the year.
USA and Other Markets: Interest in Korea Spreads from Short-Haul to Long-Haul Destinations
Inbound visitors from the U.S. reached 962,000 between January and July 2026, up by 99,000, or 11.6%, compared to the same period last year. Average search indices for "Arts & Entertainment" and "Food & Drink" during January–July were 47.3% and 37.7% higher than the previous year, respectively. Additionally, flight frequencies from the U.S. to Korea grew by 6.2%, while the KRW/USD exchange rate rose 4.8%, increasing the purchasing power of the U.S. Dollar. This expansion is significant as it demonstrates that inbound growth—previously concentrated in short-haul markets—is extending into long-haul markets.
Beyond the top four source markets, foreign arrivals grew from 3.587 million to 4.161 million, an increase of 574,000 visitors (16.0%) that accounted for 25.6% of overall growth. This growth was broadly distributed across Asian markets like Hong Kong, the Philippines, and Indonesia, as well as long-haul markets including Canada, the UK, and Australia.
Expanding interest in Korean culture is evident across these countries as well. In Canada, the UK, and Australia, search indices across both categories rose substantially year-over-year (+32% to +55% per index), while Vietnam, Thailand, and Singapore also posted double-digit gains in both search categories. However, the combination of flight availability and exchange rate dynamics varied across markets: while Hong Kong, Canada, and the UK enjoyed improvements in both flight capacity and currency valuation, arrival numbers from the Philippines, Vietnam, and Thailand grew despite reductions in flight supply.2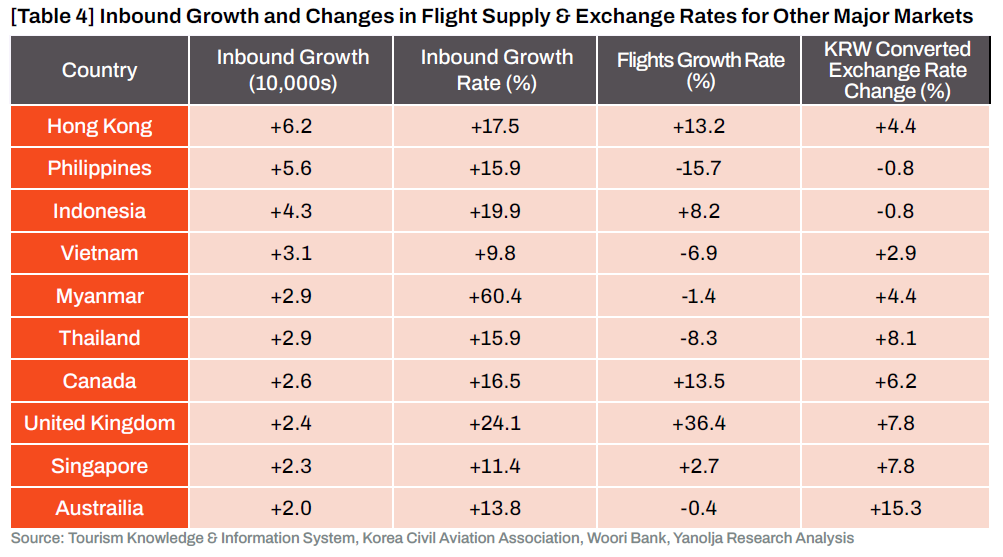
Therefore, rather than attempting to explain growth across all markets solely through K-culture, it is more accurate to view the expanding interest in K-culture and Korea as the most prominent common demand signal uniting these diverse markets. The mechanisms that converted this interest into actual visits—such as flight capacity, exchange rates, overseas travel sentiment, and market-specific triggers—operated differently depending on the country.
In summary, growing interest in K-culture serves as a foundational demand base that establishes Korea as an "appealing destination". Market-specific events, such as China's destination reallocation and the expansion of outbound travel in Japan and Taiwan, amplified this demand. Meanwhile, travel conditions like airline supply and favorable exchange rates supported the conversion of this interest into actual visits. What the initial early-year forecast failed to capture was both the intensity with which enthusiasm for K-culture translated into gains in destination market share and the speed with which this trend expanded beyond core short-haul markets.
Revised Inbound Demand Forecast for 2026 Reflecting the New Reality
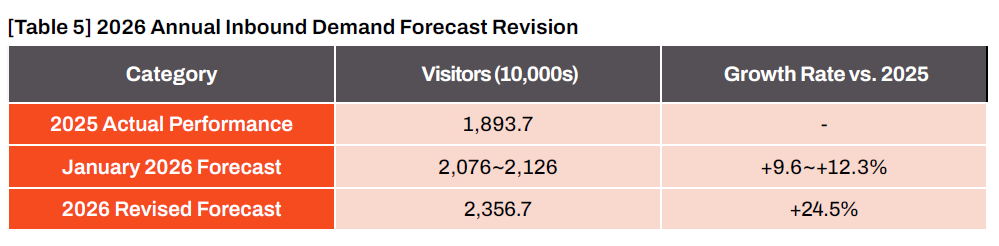
Yanolja Research has re-estimated the annual inbound foreign visitors for 2026, incorporating actual performance metrics through July and secured demand indicators through August. According to the analysis, total annual inbound demand for 2026 is projected to reach approximately 23.57 million visitors. This figure stands about 2.31 million higher than the upper bound of the initial forecast range of 20.76 million to 21.26 million visitors.
Forecasting Methodology and Model Validation
The projection utilized a Long Short-Term Memory (LSTM) network, a deep learning model designed for sequential time-series data. Predictor variables included GDP, income, population, search interest metrics, exchange rates, total flight frequencies, and jet fuel prices, alongside seasonality, entry policy updates, and major geopolitical events such as China-Japan conflict. Expanding interest in Korea was captured via search interest indices; shifts in price and airline supply were captured through real exchange rates and flight frequencies; and destination reallocation tied to China-Japan relations was incorporated into the model using event dummy variables.
Model validation performance was verified by using data through February 2026 to forecast foreign arrivals for the subsequent five months (March to July) and comparing those estimates against actual performance. Actual arrival data for the evaluation period was excluded from model training.3 The validation yielded a Mean Absolute Percentage Error (MAPE) of 3.6% per month, while the five-month cumulative forecast (10.236 million visitors) exceeded actual performance (10.106 million visitors) by just 1.3%. This backtesting validation trained the model on historical data available up to February 2026, generated demand projections for March through July, and compared the results with actual inbound statistics. Detailed monthly validation results are provided in Appendix [Table A1].
2026 Annual Inbound Foreign Tourist Forecast: Approximately 23.57 Million
The final forecast incorporates actual inbound performance through July 2026 and related demand indicators available through August. Based on the model analysis, annual inbound foreign tourists to Korea in 2026 are projected to reach 23.567 million (approximately 23.57 million). This reflects an increase of about 4.630 million visitors, or 24.5%, compared to 18.937 million in 2025. Relative to the early-year forecast range of 20.76 million to 21.26 million presented in January, this revised projection exceeds the lower bound by 2.807 million visitors and the upper bound by 2.307 million.
This upward revision is not merely a result of higher-than-expected performance during the January–July period. As performance in Japan and Taiwan significantly surpassed early-year assumptions alongside sustained growth in the U.S. and other markets, updated explanatory variables—including search interest, flight frequencies, and exchange rates—captured the stronger multi-market interest in Korea and destination preference. Explanatory variables for September through December reflect a conditional path assuming that recent trends observed through August will persist; thus, the 23.57 million figure represents a forecast predicated on the continuation of these favorable conditions.
Where Will the Additional 2.386 Million Visitors Come from Between August and December?
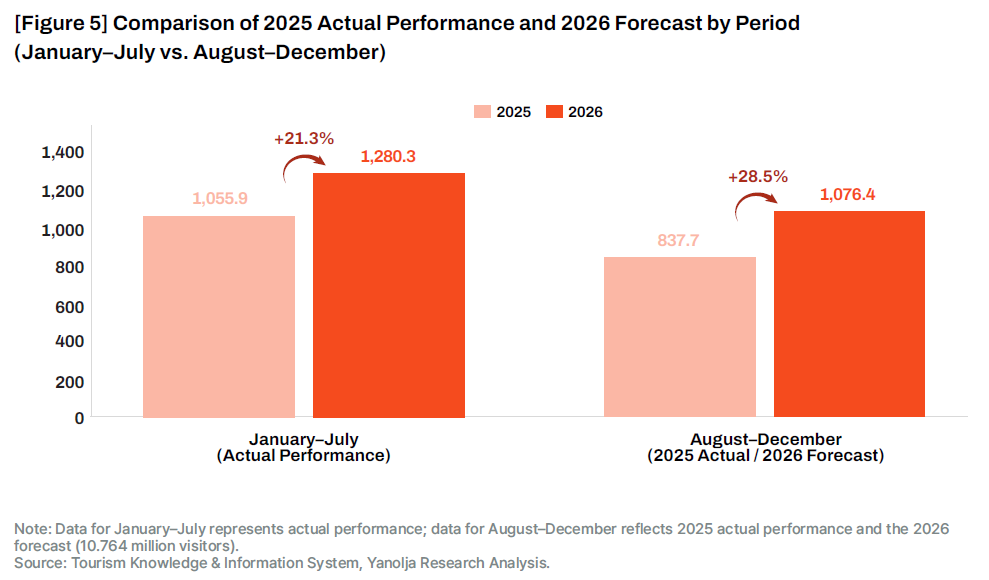
The annual forecast of 23.567 million visitors is calculated by combining actual arrivals from January to July (12.803 million) with the projected arrivals for August through December (10.764 million). Given that arrivals during the August–December period in 2025 totaled 8.377 million, approximately 2.386 million additional visitors must arrive during the remaining five months. This requires a growth rate of 28.5%, which is 7.2 percentage points higher than the cumulative growth rate of 21.3% observed from January to July. In other words, this forecast assumes a stronger growth trajectory than simply maintaining the growth rate of the first seven months.
The explanation lies in how the model incorporates recent levels of demand variables. The higher projected growth rate for the second half compared to the first half is the result of the LSTM model reflecting the dynamic relationship between historical demand and the recently observed levels of key variables—such as search interest, flight supply, and exchange rates. Thus, the 23.57 million figure is not an arbitrarily assumed second-half growth rate of 28.5%, but a model-generated output conditioned on the recent level of favorable explanatory variables. Several factors support the likelihood of these conditions persisting into the second half: monthly growth rates between April and July remained steady at 18.8%–23.1%, July arrivals reached the highest monthly peak of the year, preference rates and search interest for Korea in Japan and Taiwan remained elevated through July, and the growth foundation broadened significantly—with non-top four markets accounting for 25.6% of total growth.
However, a key caveat must be noted. Because the destination reallocation effect from China enters the year-over-year comparison baseline starting in November 2025, the year-over-year growth rate from China in November and December may slow relative to the first half. Consequently, the 28.5% growth target for August through December should be understood as relying more heavily on the combined expansion of Japan, Taiwan, the U.S., and other global markets rather than on China alone.
Whether this forecast is realized depends on whether the three-layered dynamics identified earlier persist through the second half of the year. Key factors to watch include whether China maintains its elevated preference for Korea as a destination, whether strong interest in K-culture and expanded air accessibility in Japan and Taiwan continue to translate into actual bookings and visits, and whether growth momentum across long-haul and other markets—including the U.S.—remains sustained. If these conditions weaken, actual arrivals may fall short of the projected figure.
Conclusion: Time to Move Beyond "Recovery" and Prepare for “Growth”
As of 2026, Korea's inbound tourism market is growing far faster than anticipated earlier in the year. While short-term drivers such as China's destination reallocation contributed to this surge, the rising preference for Korea in Japan and Taiwan—alongside expanding demand from the U.S. and various long-haul markets—points to a structural and long-lasting shift. Across multiple source markets, widespread enthusiasm for K-culture serves as the primary demand signal driving this expansion, enhancing Korea's pull factors as an international destination and reshaping its global image. This impact is clearly reflected in entry data, where Japanese and Taiwanese travel to Korea outpaced their overall outbound travel growth, allowing Korea to capture a larger share of those markets.
Reflecting this transformed landscape, Yanolja Research revised its 2026 forecast for foreign inbound visitors upward to approximately 23.57 million. This update goes beyond a simple numerical adjustment, replacing initial projections based on early-year assumptions with newly accumulated performance data and updated demand metrics. The realization of this target will depend on three key indicators: maintaining Korea's 6.5% market share among Chinese travelers across 22 tracked destinations, sustaining high K-culture search interest alongside Korea's elevated share of outbound travel in Japan and Taiwan, and preserving favorable enabling conditions such as expanded flight capacities and competitive exchange rates for the Korean Won.
Consequently, policy and industry leaders must transition from asking whether foreign tourists will return to addressing how to stably accommodate this expanding demand while translating it into higher spending, regional disbursement, and repeat visits. For long-haul markets like the U.S., Canada, the UK, and Australia, growth should be integrated with local festivals and cultural products to encourage longer stays and regional economic impact. For core short-haul markets like Japan and Taiwan, diversifying regional and seasonal content is critical for fostering repeat travel. Finally, given potential volatility surrounding the sustainability of China's destination reallocation effect, strategies targeting the Chinese market must balance volume growth with targeted measures to enhance spending quality.
 Prev
Prev  Back
Back