
[YR] BRIEF Vol.18. Analysis of Korea's Inbound and Outbound Tourism Performance in Jan-Sep 2026
- Reg Date
- 2026.11.09


Analysis of Korea's Inbound and Outbound Tourism Performance in January-September 2026
Executive Summary
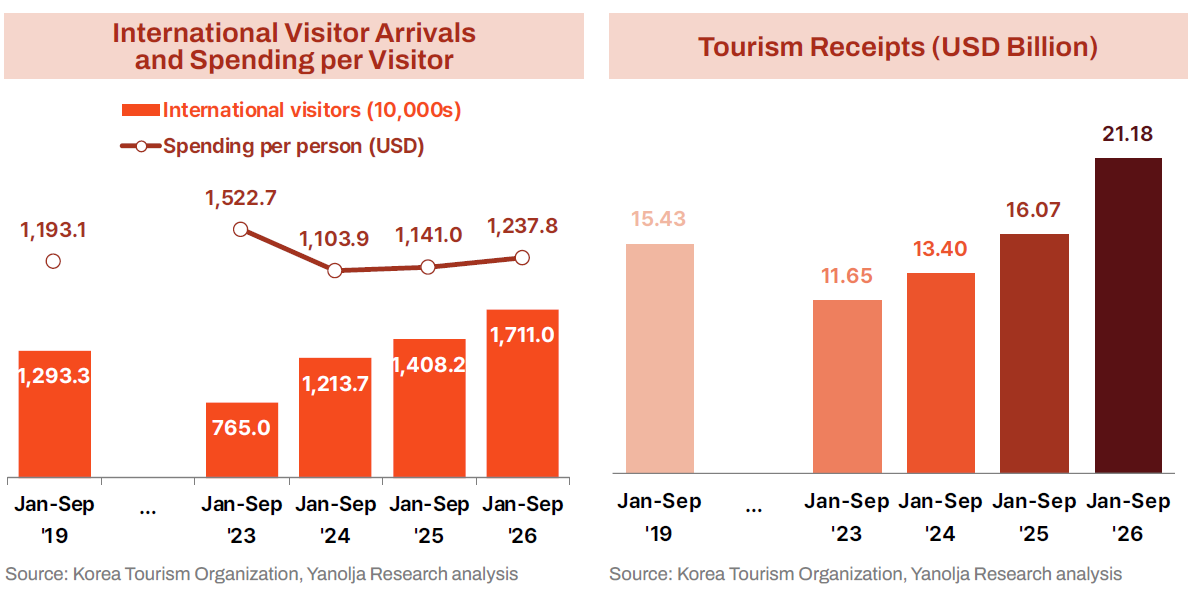
- Inbound tourism: International visitor arrivals reached 17.110 million in January–September 2026, a record high for the period (+21.5% YoY, +32.3% vs. 2019). Tourism receipts (USD 21.18 billion, +31.8%) and receipts per visitor (USD 1,237.8, +8.5%) also rose, pushing both the scale of inbound tourism and per-visitor receipts above 2019 levels.
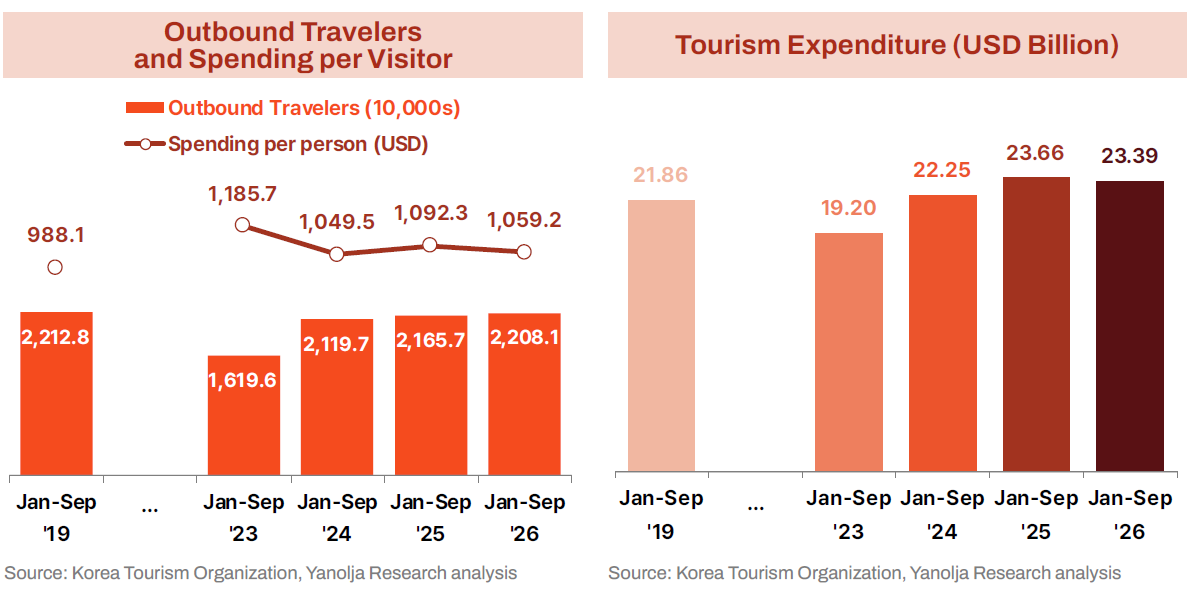
- Outbound tourism: Korean outbound travelers numbered 22.081 million, effectively back to 2019 levels (-0.2%). However, growth was concentrated in Japan (+21.6%) and China (+14.3%), while many destinations such as the US, Thailand, and Hong Kong declined, leaving a clear gap in recovery across destinations. Tourism expenditure in USD terms (USD 23.39 billion) fell 1.1% YoY, but a weaker won lifted the KRW-equivalent amount (approx. KRW 34.2 trillion) by 2.4%.
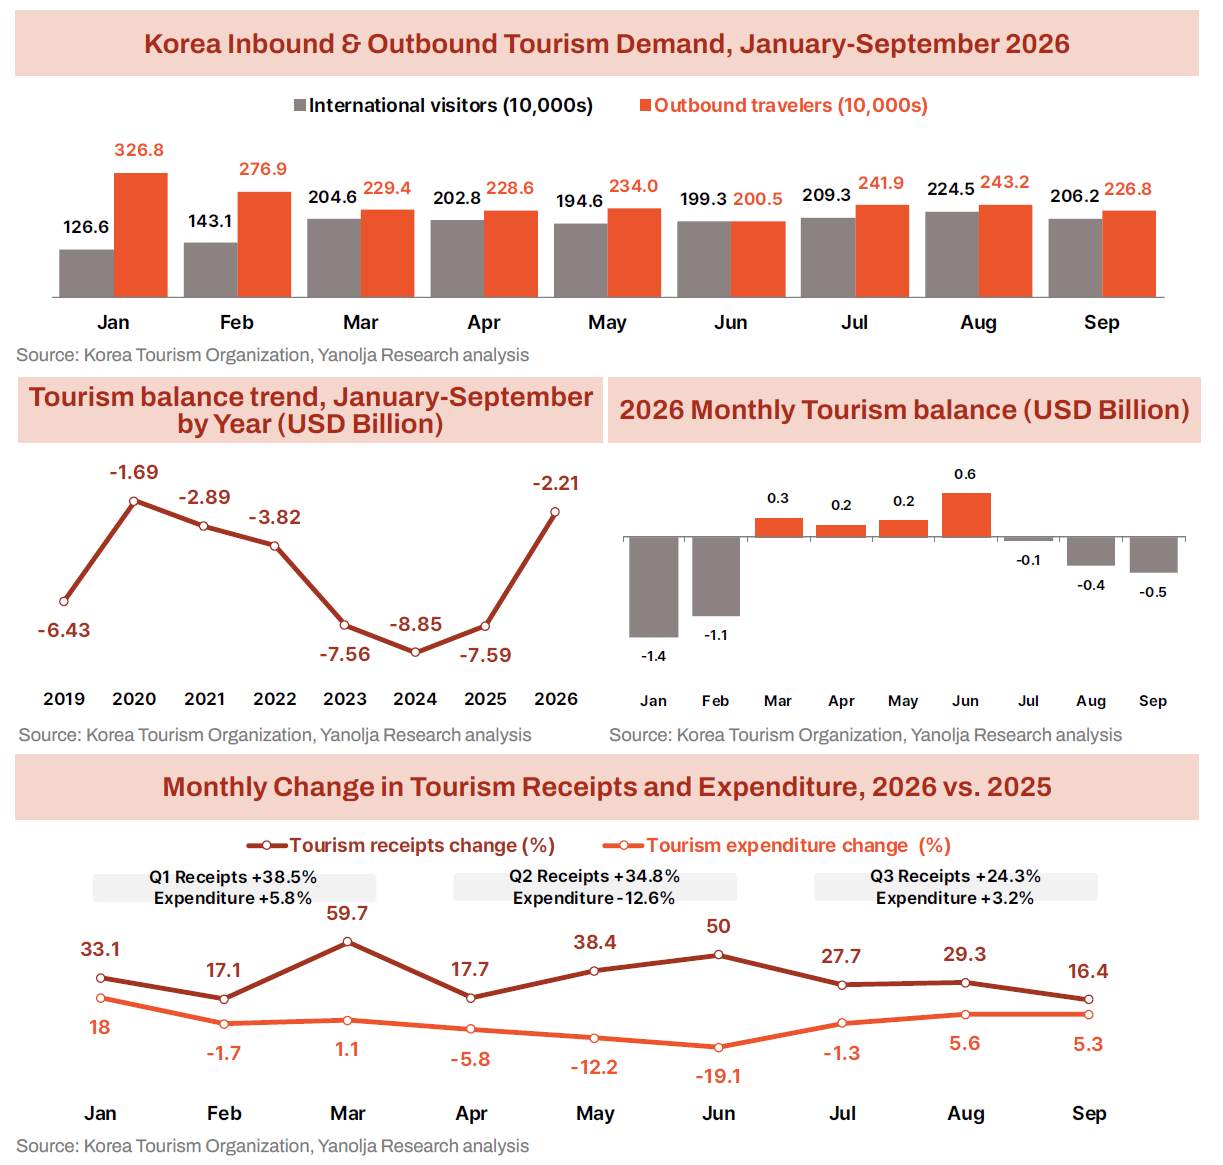
- Tourism balance: The cumulative January–September tourism balance posted a deficit of USD 2.21 billion, 70.9% narrower than a year earlier (-USD 7.59 billion). About 95% of the USD 5.38 billion improvement came from higher tourism receipts. After turning to a surplus in Q2 (+USD 0.98 billion), the balance slipped back into deficit in Q3 (-USD 0.95 billion), though the deficit was 56.1% smaller than in the same quarter last year.
- Outlook: Annual arrivals are virtually certain to surpass 20 million, but turning the full-year tourism balance into a surplus would require a Q4 surplus of more than USD 2.21 billion. Slower receipts growth in Q3 (+24.3%), a rebound in outbound spending (+3.2%) and the won’s recovery could weigh on the balance, so the key question is whether rising arrivals translate into higher per-visitor spending.
Inbound Tourism Performance
International visitor arrivals: 17.11 million in Jan–Sep 2026, a record high, with growth sustained throughout the year
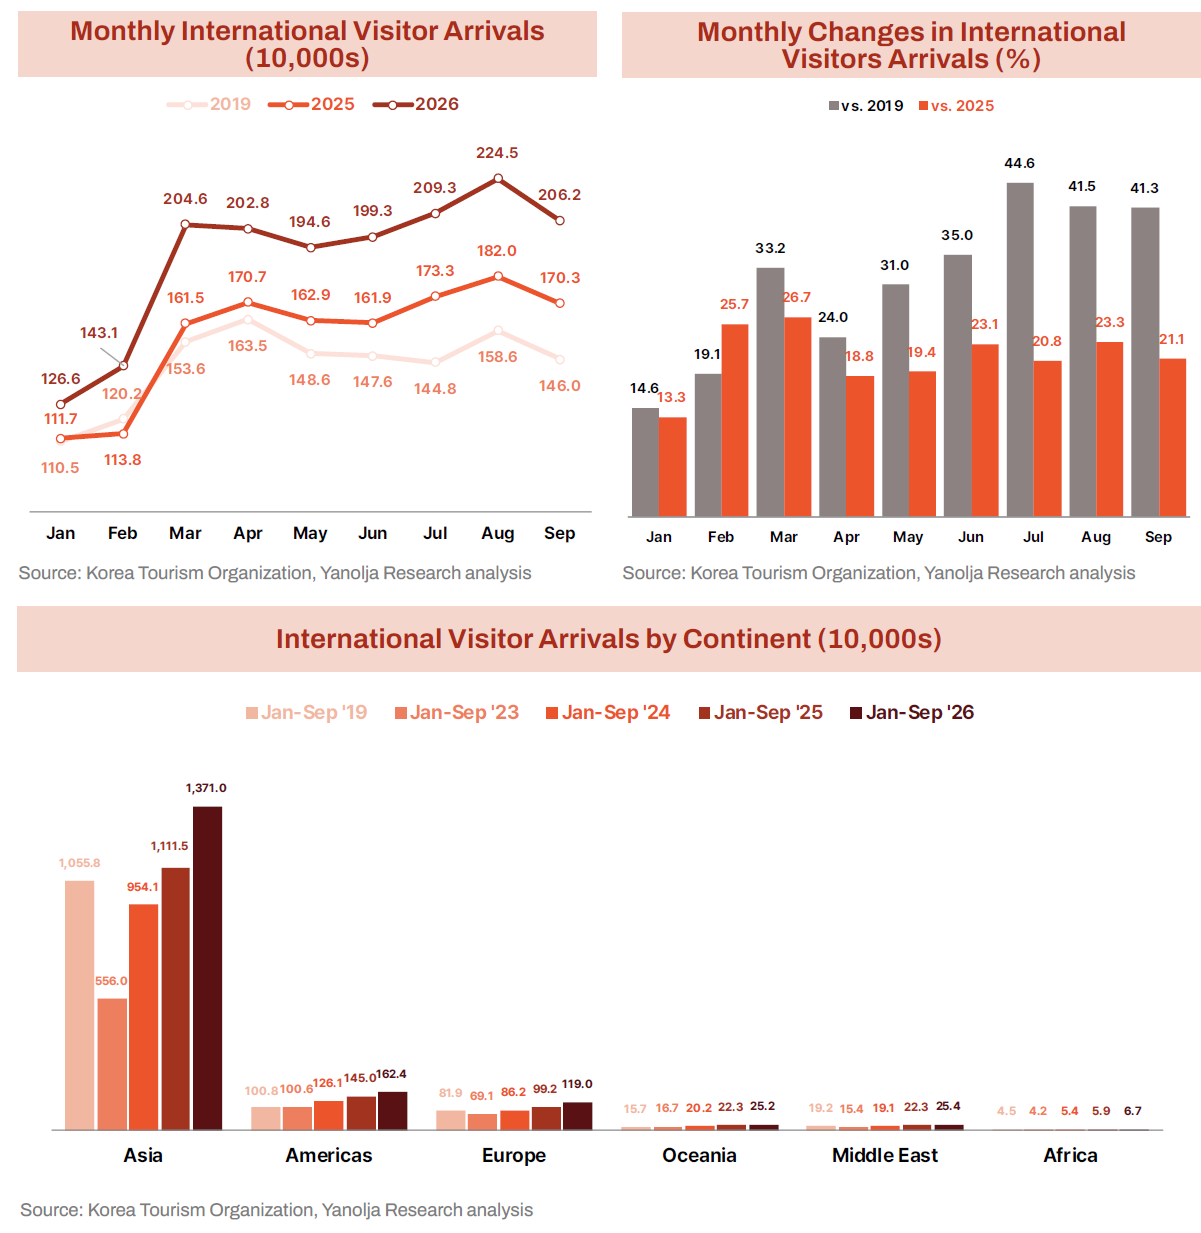
- International visitor arrivals to Korea reached 17.110 million in January–September 2026, the highest ever for the period. This is up 21.5% from a year earlier and 32.3% from the same period in 2019. Every month from January to September exceeded the same month of the previous year by 13.3–26.7%, and arrivals topped 2 million each month from July to September. August in particular set a monthly record at 2.245 million. This points to a sustained expansion of demand for travel to Korea rather than a temporary rebound in any single month.
- Asia remains the engine of growth. Visitors from Asia totaled 13.710 million (+23.3%), accounting for 80.1% of the total. At the same time, demand from outside Asia also grew, including Europe at 1.190 million (+20.0%) and the Americas at 1.624 million (+12.0%). Oceania (252,000, +13.0%), the Middle East (254,000, +13.8%) and Africa (67,000, +13.7%) also increased. In short, the market base is broadening, but heavy reliance on Asia persists.
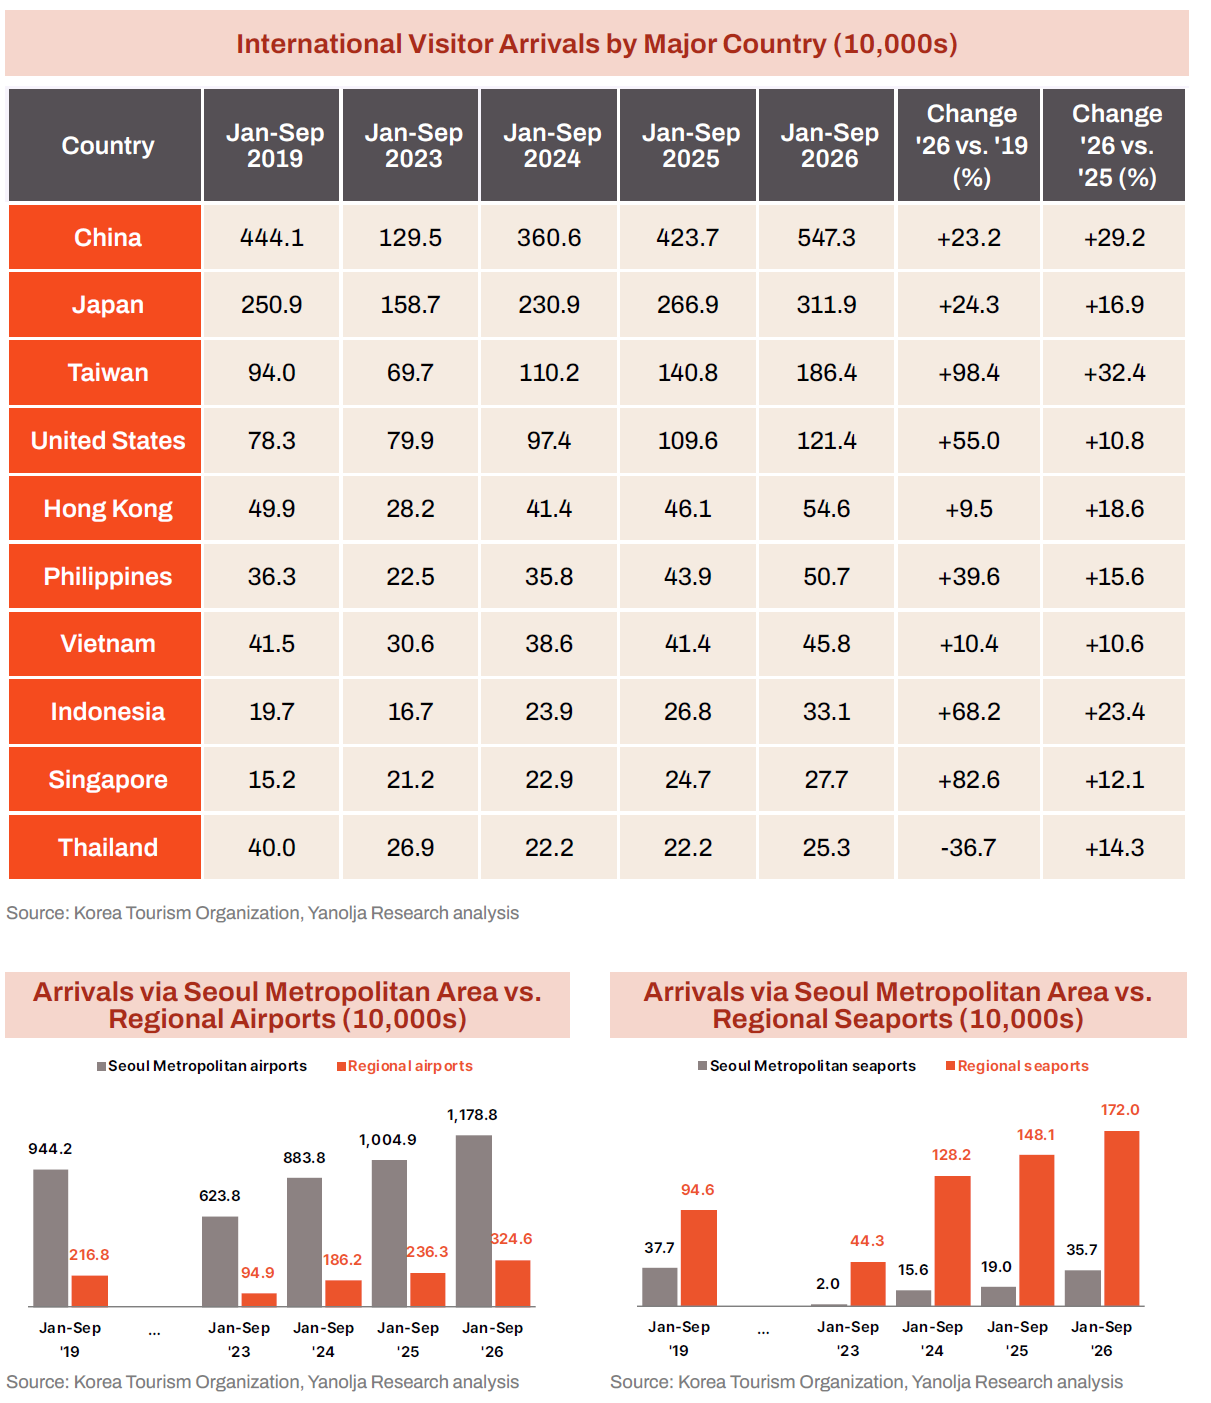
- By country, China, Japan, and Taiwan led the growth. China recorded 5.473 million (+29.2%), Japan 3.119 million (+16.9%) and Taiwan 1.864 million (+32.4%). Taiwan posted the highest YoY growth among the top 10 markets and was up 98.4% from 2019. The US, the largest market outside Asia, also expanded to 1.214 million (+10.8%). Amid broad growth across major markets, Taiwan’s surge stands out.
- Changes are also visible at ports of entry. Arrivals through Seoul metropolitan area airports totaled 11.788 million, up 24.9% from 2019 and 17.3% YoY. Arrivals through regional airports reached 3.246 million, growing faster at +49.7% and +37.4%, respectively. As a result, regional airports’ share of total airport arrivals rose from about 18.7% in 2019 to about 21.6% in 2026. Arrivals through regional seaports also rose 81.8% from 2019 to 1.720 million, whereas seaports in the Seoul metropolitan area handled about 357,000, 5.4% fewer than in 2019. The faster growth of regional airports suggests that visitors’ entry routes are gradually diversifying.
Tourism receipts: Receipts outpace arrivals growth, with mixed results across spending categories
- Tourism receipts in January–September 2026 reached USD 21.18 billion, up 31.8% YoY and 37.3% from the same period in 2019. Importantly, receipts grew faster than arrivals (+21.5%) over the same period. Receipts per visitor also rose to USD 1,237.8, up 8.5% from last year (USD 1,141.0) and 3.7% from 2019 (USD 1,193.1). In other words, growth in both visitor numbers and per-visitor receipts drove the increase in total receipts.
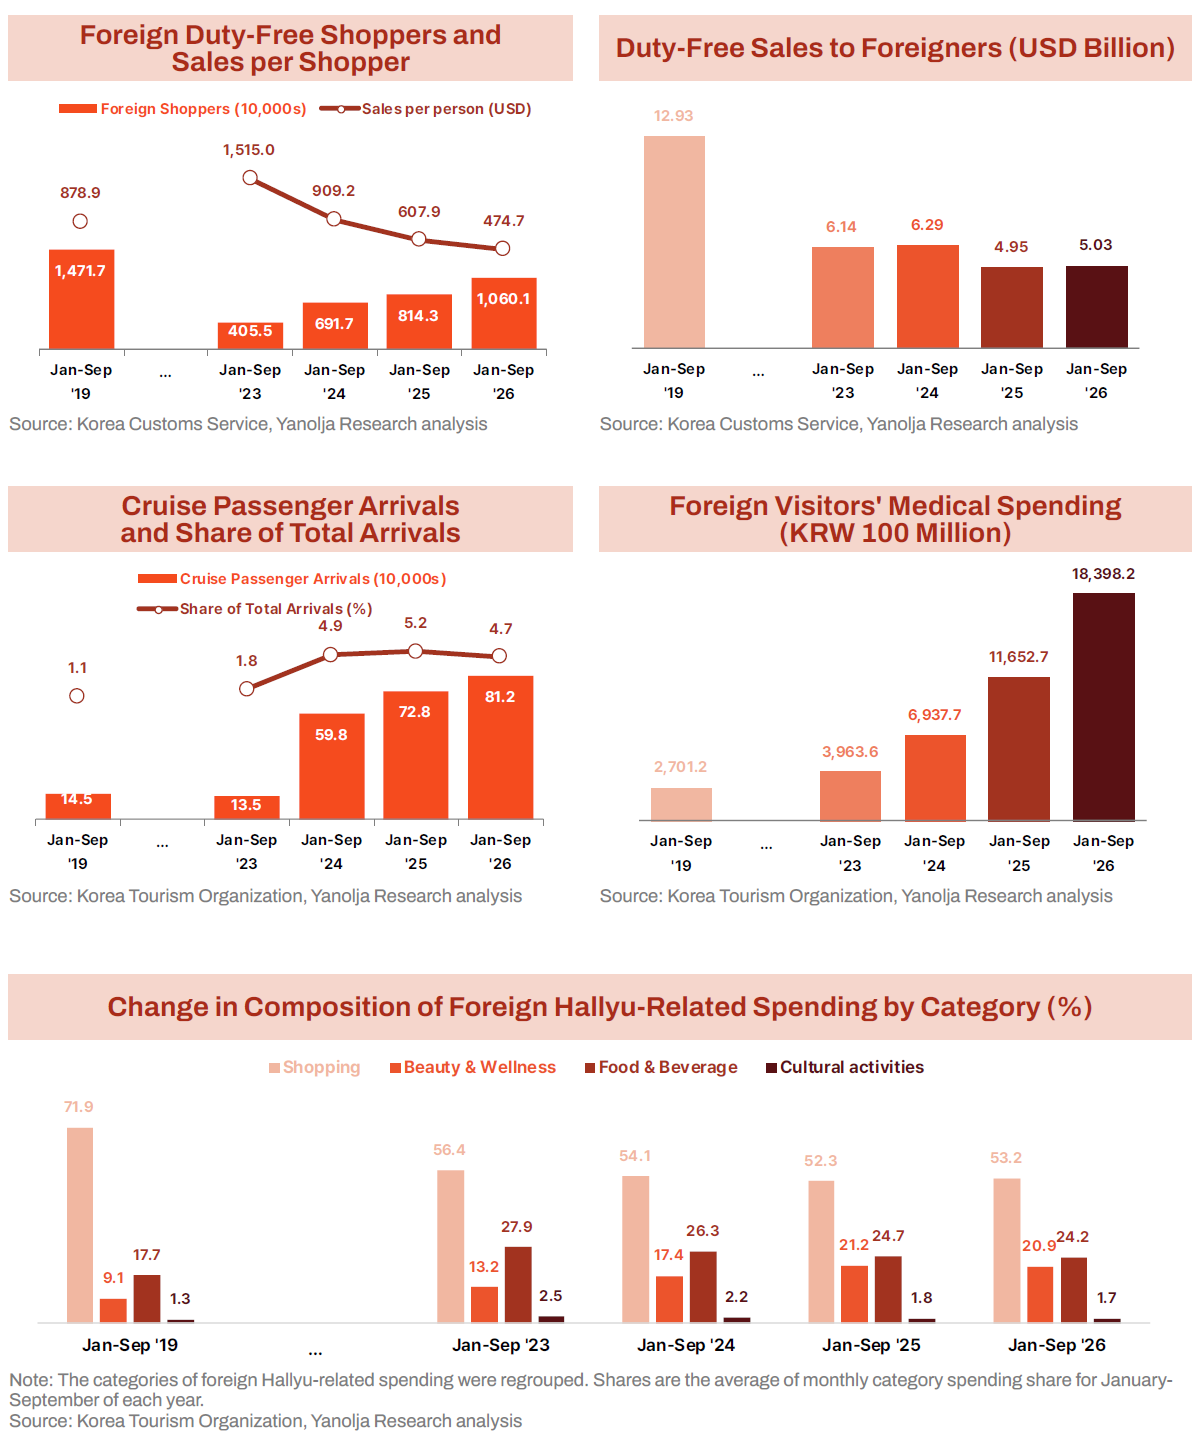
- Service and experience spending such as medical, beauty, and wellness is becoming more important in inbound tourism consumption. Foreign visitors’ medical spending reached KRW 1.8398 trillion in January–September 2026, up 57.9% YoY and about 6.8 times the level of the same period in 2019. Meanwhile, the share of beauty and wellness in “Hallyu-related spending” on foreign-issued cards expanded from 9.1% in 2019 to 20.9% in 2026. Although these indicators differ in scope, they show the growth potential of medical and beauty·wellness spending.
- By contrast, traditional shopping, and duty-free stores in particular, are not fully benefiting from the rise in arrivals. Shopping’s share of Hallyu-related spending on foreign-issued cards fell 18.7 percentage points, from 71.9% in 2019 to 53.2% in 2026. Duty-free sales to foreigners were USD 5.03 billion, 61.1% below 2019 (USD 12.93 billion). Over the same period, foreign duty-free shoppers fell from 14.717 million to 10.601 million, and sales per shopper dropped from USD 878.9 to USD 474.7. In addition, the share of cruise passengers, who stay briefly and spend relatively little, rose from 1.1% in 2019 to 4.7% in 2026, which may also weigh on per-visitor receipts.
Outbound Tourism Performance
Outbound travelers: Back to 2019 levels, but demand increasingly concentrated in Japan and China
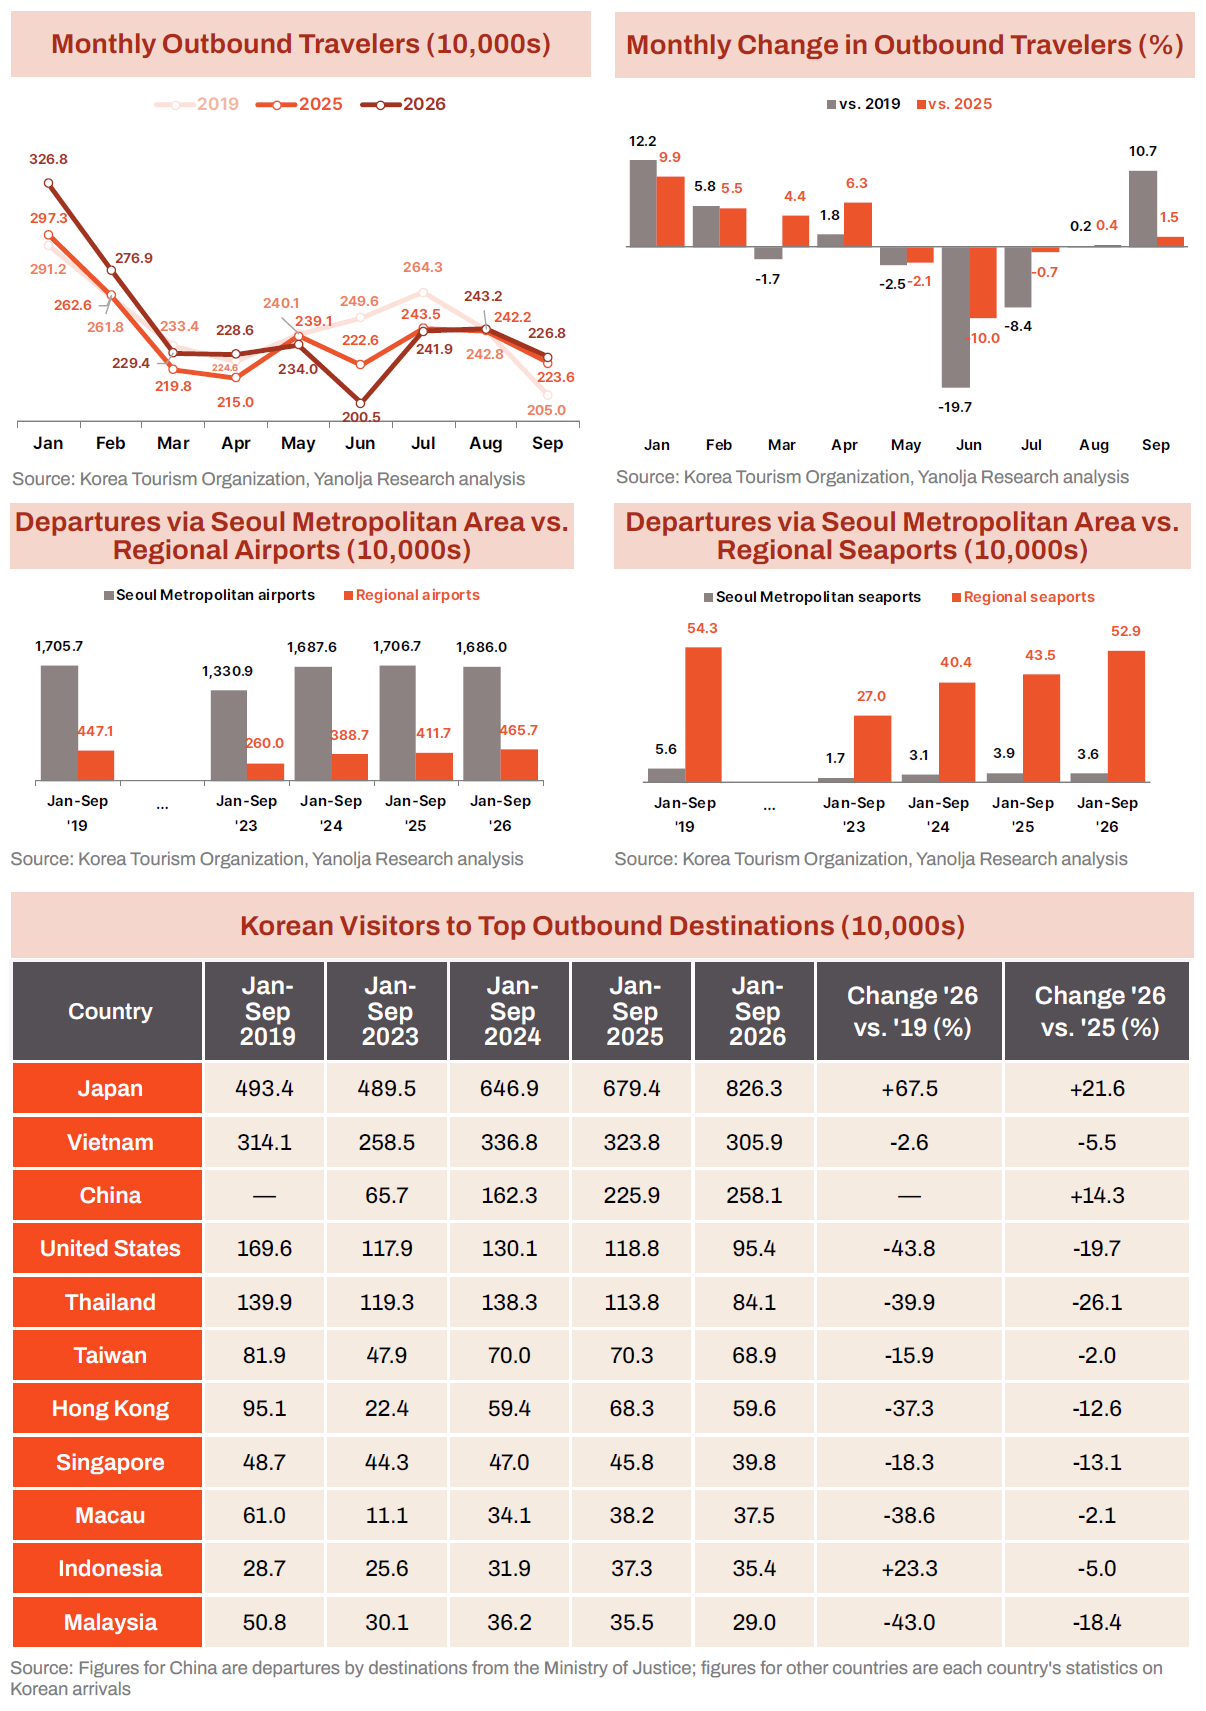
- Korean outbound travelers numbered 22.081 million in January–September 2026, up 2.0% YoY. This equals 99.8% of the same period in 2019 (22.128 million), meaning total departures are effectively close to pre-pandemic levels. However, monthly growth turned from gains in January–April to declines in May–July, before rebounding slightly in August (+0.4%) and September (+1.5%). Exchange rate movements and the burden of travel costs may have influenced this pattern.
- Demand became even more concentrated on Japan. Korean visitors to Japan totaled 8.263 million, up 21.6% YoY and 67.5% from the same period in 2019. Japan’s share of all outbound travelers rose 15.1 percentage points, from 22.3% in 2019 to 37.4% in 2026. Departures to China also increased 14.3% YoY to 2.581 million. Together, Japan and China accounted for 49.1% of all outbound travelers, nearly half.
- In contrast, destinations such as Vietnam (3.059 million, -5.5%), the US (954,000, -19.7%), Thailand (841,000, -26.1%), Hong Kong (596,000, -12.6%), Singapore (398,000, -13.1%) and Malaysia (290,000, -18.4%) declined YoY. Visitor numbers to all of these destinations remain below 2019 levels. The recovery in overall outbound demand therefore cannot be read as an even recovery across destinations.
- Among departure gateways, regional airports recovered relatively faster. Departures from Seoul metropolitan area airports were 16.860 million, 1.2% below the same period in 2019, whereas departures from regional airports rose 4.2% over the same period to 4.657 million. Departures from regional seaports (Busan, Jeju, etc.) also increased 21.6% YoY to 529,000, approaching 2019 levels. By contrast, departures from seaports in the Seoul metropolitan area were 36,000, 36.2% below 2019. Usage patterns are diverging across international gateways by region.
Tourism expenditure: Diverging trends at -1.1% in USD terms and +2.4% in KRW terms
- Korean tourism expenditure abroad in January–September 2026 was USD 23.39 billion, 7.0% more than in 2019 (USD 21.86 billion) but 1.1% less than last year (USD 23.66 billion). Expenditure per outbound traveler also fell 3.0% to USD 1,059.2 from USD 1,092.3 a year earlier. However, as the period-average KRW/USD exchange rate rose 3.6% YoY, spending in KRW terms increased 2.4% to approximately KRW 34.2 trillion (+34.6% vs. 2019). A decline in USD-denominated spending does not necessarily mean a lighter burden in won for Korean travelers.
Tourism Balance: Deficit Narrows 70.9%, but the Q3 Return to Deficit Leaves Work to Be Done
- The travel balance for January–September 2026 showed a deficit of USD 2.21 billion, 70.9% narrower than a year earlier (deficit of USD 7.59 billion). Record growth in arrivals and higher tourism receipts drove this improvement. According to the Ministry of Culture, Sports and Tourism, arrivals as of October 27 had already exceeded last year’s all-time annual record of 18.94 million. Annual arrivals topping 20 million for the first time in 2026 are now within sight, and expectations of 23 million by year-end have also been raised.
- On a monthly basis, the travel balance recorded large deficits in January (-USD 1.40 billion) and February (-USD 1.10 billion), but posted surpluses for four consecutive months from March (+USD 0.26 billion) through June. Q2 as a whole showed a surplus of USD 0.98 billion, and the cumulative first-half deficit narrowed to USD 1.26 billion. Q3, however, slipped back to a deficit of USD 0.95 billion. Even so, the Q3 deficit was 56.1% smaller than in the same quarter last year.
- The narrowing of the deficit was driven by higher inbound tourism receipts rather than lower outbound spending. In January–September, tourism receipts rose USD 5.11 billion YoY, while Korean tourism expenditure fell USD 0.27 billion. About 95% of the USD 5.38 billion improvement in the travel balance came from higher receipts. The key drivers were the simultaneous rise in arrivals (+21.5%) and receipts per visitor (+8.5%), whereas departures rose 2.0% but expenditure per traveler fell 3.0%. This is significant in that the improvement was led by growth in receipts.
- In Q3, however, different signals emerged. Arrivals growth held at a similar pace (21.3% in the first half, 21.8% in Q3), but receipts growth slowed from 38.5% in Q1 to 34.8% in Q2 and 24.3% in Q3. At the same time, Korean tourism expenditure swung from a 12.6% YoY decline in Q2 to a 3.2% increase in Q3. The real effective exchange rate also rose from 85.4 in July to 92.7 in September. These shifts appear related to the won’s appreciation since July, which eased the cost burden of overseas travel for Koreans.
- For the full-year tourism balance to turn positive, a Q4 surplus exceeding USD 2.21 billion is needed. Annual arrivals expected to surpass 20 million are encouraging, but given slower receipts growth and the rebound in outbound spending in Q3, a surplus cannot be taken for granted. Going forward, not only the number of visitors but also receipts per visitor, the spread of high-value spending, and changes in Korean outbound spending will determine whether the improvement in the travel balance can be sustained.
Conclusions and Implications: Time to Turn Visitor Growth into Tourism Receipts and Regional Economic Gains
- The key achievement of Korea’s tourism market in January–September 2026 is that growth in arrivals (+21.5%) translated into higher tourism receipts (+31.8%) and a 70.9% narrower travel deficit. Notably, about 95% of the improvement in the travel balance came from higher receipts. In Q3, however, receipts growth slowed even as arrivals growth held steady. Going forward, performance evaluation should broaden its focus from “number of visitors” to “the value that remains through stays, spending and the regions.”
- The industry must respond to shifts in spending patterns. Growth in medical spending and Hallyu-related beauty and wellness spending presents new opportunities, while the simultaneous decline in foreign duty-free shoppers and average spend per customer reveals the limits of the traditional shopping-centered model. The accommodation, tourism and retail sectors need to strengthen stay-oriented products that combine medical and wellness services, local food and beverage, and experiences.
- Growth at regional gateways must be linked to regional economic gains. Arrivals through regional airports grew 37.4% YoY, faster than through Seoul metropolitan area airports (17.3%). However, where visitors enter may differ from where they actually stay and spend. Central and local governments should track not only regional arrivals but also nights stayed by region, travel routes and card spending, and design policies that connect transportation, accommodation and experiences.
- Performance indicators also need to be upgraded. In addition to the travel balance and visitor arrivals, the government should look comprehensively at receipts per visitor, stays and spending by region, and spending performance by category. Hotels, OTAs and tourism businesses could consider product strategies that link customers’ movement and spending to lengthen stays and increase local spending. The slowdown in receipts growth in Q3 suggests that the task of converting quantitative growth into stable economic gains still remains.
 Prev
 Back